gain_curve() 构造完整的增益曲线并返回一个 tibble。有关增益曲线下的相关区域,请参阅gain_capture()。另请参阅lift_curve() 了解密切相关的概念。
用法
gain_curve(data, ...)

# S3 method for data.frame
gain_curve(
  data,
  truth,
  ...,
  na_rm = TRUE,
  event_level = yardstick_event_level(),
  case_weights = NULL
)
参数
- data
-
包含
truth和...指定的列的data.frame。 - ...
-
一组不带引号的列名称或一个或多个
dplyr选择器函数,用于选择哪些变量包含类概率。如果truth是二进制,则仅应选择 1 列,并且它应对应于event_level的值。否则,列的数量应与truth的因子级别一样多,并且列的顺序应与truth的因子级别相同。 - truth
-
真实类结果的列标识符(即
factor)。这应该是一个不带引号的列名,尽管此参数是通过表达式传递的并且支持quasiquotation(您可以不带引号的列名)。对于_vec()函数,一个factor向量。 - na_rm
-
logical值,指示在计算继续之前是否应剥离NA值。 - event_level
-
单个字符串。
"first"或"second"指定将truth的哪个级别视为"event"。此参数仅适用于estimator = "binary"。默认使用内部帮助程序,通常默认为"first",但是,如果设置了已弃用的全局选项yardstick.event_first,则将使用该帮助程序并发出警告。 - case_weights
-
案例权重的可选列标识符。这应该是一个不带引号的列名称,其计算结果为
data中的数字列。对于_vec()函数,一个数值向量。
值
类 gain_df 或 gain_grouped_df 的 tibble 具有列:
-
.n当前样本的索引。 -
.n_events当前唯一样本的索引。具有重复estimate值的值在此列中给出相同的索引。 -
.percent_tested测试值的累积百分比。 -
.percent_found真实结果相对于真实结果总数的累积百分比。
如果使用 case_weights 参数,以上所有列都将被加权。这对于频率权重来说最有意义,频率权重是表示特定观察应重复的次数的整数权重。
细节
有一个ggplot2::autoplot() 方法可以快速可视化曲线。这适用于二进制和多类输出,也适用于分组数据(即来自重新采样)。请参阅示例。
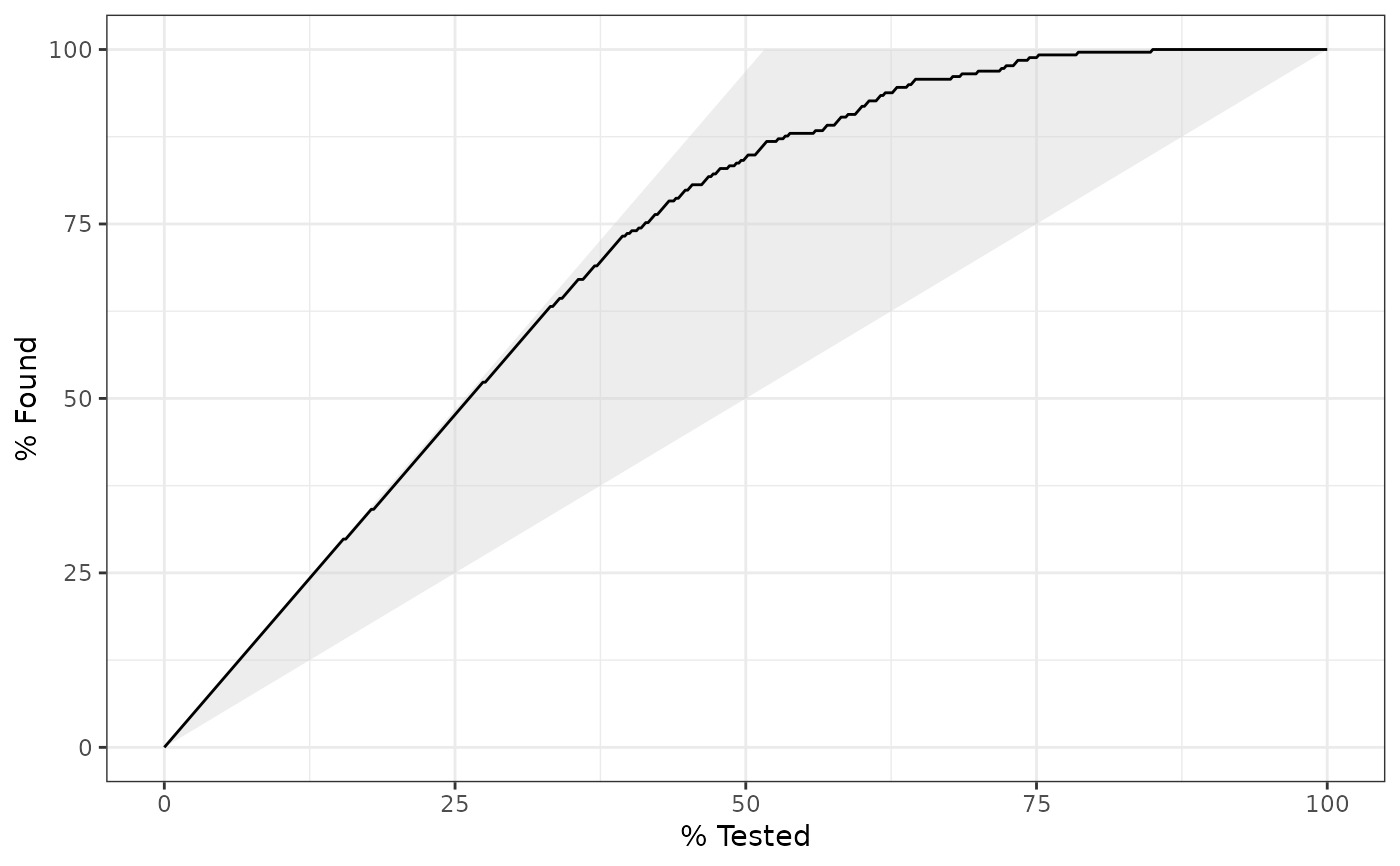
增益曲线和基线之间的面积越大,模型越好。
增益曲线与 CAP 曲线(累积精度曲线)相同。有关 CAP 曲线的更多信息,请参阅 Engelmann 引用。
增益和提升曲线
累积增益和提升图背后的动机是作为一种可视化方法,用于确定模型与没有模型时可能预期的结果相比的有效性。举个例子,在没有模型的情况下,如果您要向随机 10% 的客户群做广告,那么您可能期望获得向整个客户群做广告时获得的积极响应总数的 10%。给定一个预测哪些客户更有可能做出响应的模型,希望您能够更准确地定位 10% 的客户群并捕获> 积极响应总数的 10%。
构建增益曲线的计算如下:
-
truth和estimate按estimate值降序排列(此处的estimate是...中提供的单个列)。 -
求出真实结果样本的累计数量相对于真实结果总数的比例。这是增益图表中的 y 轴。
多级
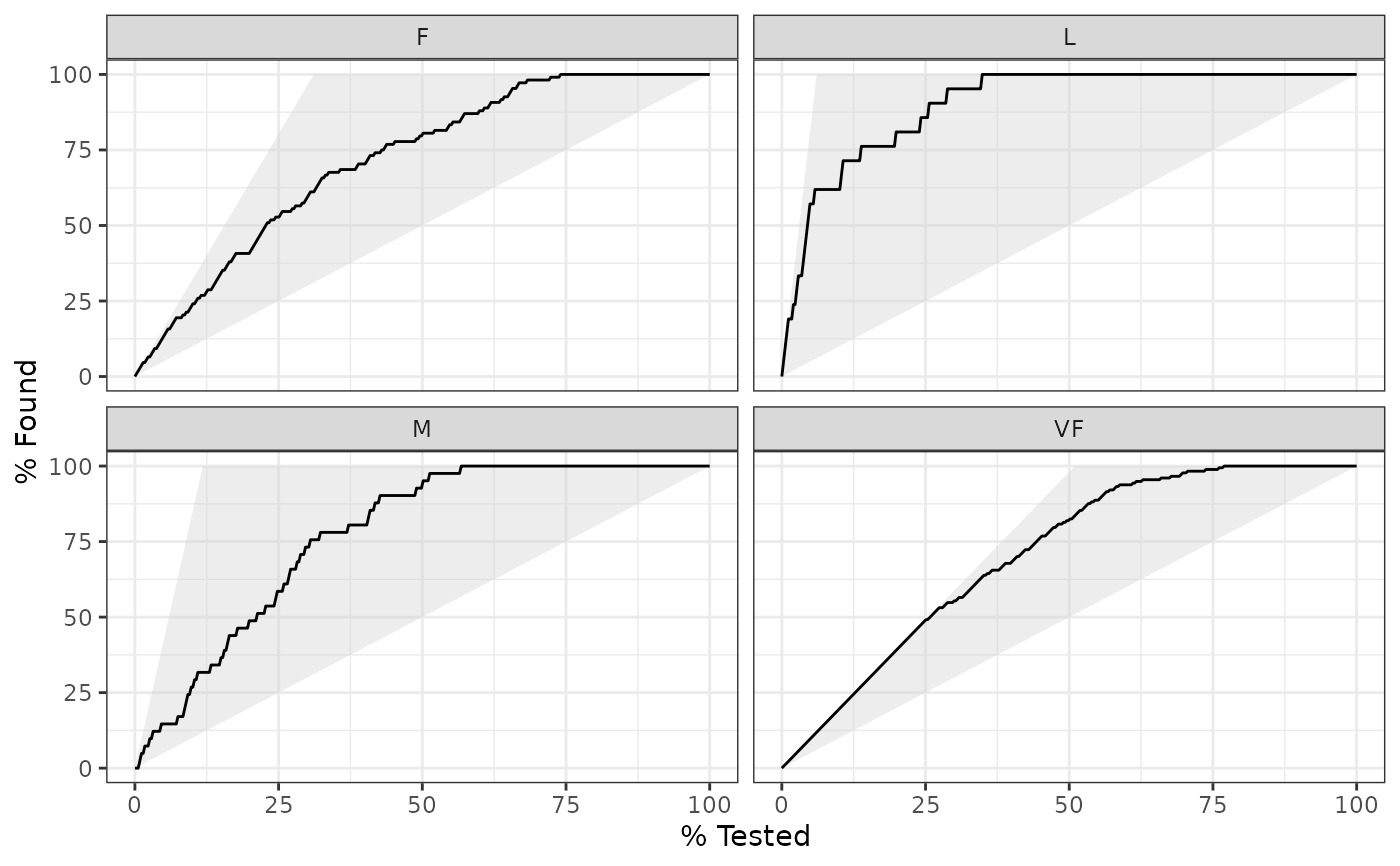
如果提供了多类 truth 列,则将采用 one-vs-all 方法来计算多条曲线,每个级别一条。在这种情况下,将有一个附加列 .level ,用于标识 one-vs-all 计算中的 "one" 列。
相关级别
在计算二元分类指标时,对于哪个因子级别应自动被视为 "event" 或 "positive" 结果,没有通用约定。在 yardstick 中,默认使用第一级。要更改此设置,请将参数 event_level 更改为 "second" 以将因子的最后一个级别视为感兴趣级别。对于涉及 one-vs-all 比较(例如宏平均)的多类扩展,此选项将被忽略,并且 "one" 级别始终是相关结果。
也可以看看
使用 gain_capture() 计算增益曲线下的相关面积。
其他曲线指标:lift_curve()、pr_curve()、roc_curve()
例子
# ---------------------------------------------------------------------------
# Two class example

# `truth` is a 2 level factor. The first level is `"Class1"`, which is the
# "event of interest" by default in yardstick. See the Relevant Level
# section above.
data(two_class_example)

# Binary metrics using class probabilities take a factor `truth` column,
# and a single class probability column containing the probabilities of
# the event of interest. Here, since `"Class1"` is the first level of
# `"truth"`, it is the event of interest and we pass in probabilities for it.
gain_curve(two_class_example, truth, Class1)
#> # A tibble: 501 × 4
#>       .n .n_events .percent_tested .percent_found
#>    <dbl>     <dbl>           <dbl>          <dbl>
#>  1     0         0             0            0
#>  2     1         1             0.2          0.388
#>  3     2         2             0.4          0.775
#>  4     3         3             0.6          1.16
#>  5     4         4             0.8          1.55
#>  6     5         5             1            1.94
#>  7     6         6             1.2          2.33
#>  8     7         7             1.4          2.71
#>  9     8         8             1.6          3.10
#> 10     9         9             1.8          3.49
#> # ℹ 491 more rows

# ---------------------------------------------------------------------------
# `autoplot()`

library(ggplot2)
library(dplyr)

# Use autoplot to visualize
# The top left hand corner of the grey triangle is a "perfect" gain curve
autoplot(gain_curve(two_class_example, truth, Class1))


# Multiclass one-vs-all approach
# One curve per level
hpc_cv %>%
  filter(Resample == "Fold01") %>%
  gain_curve(obs, VF:L) %>%
  autoplot()


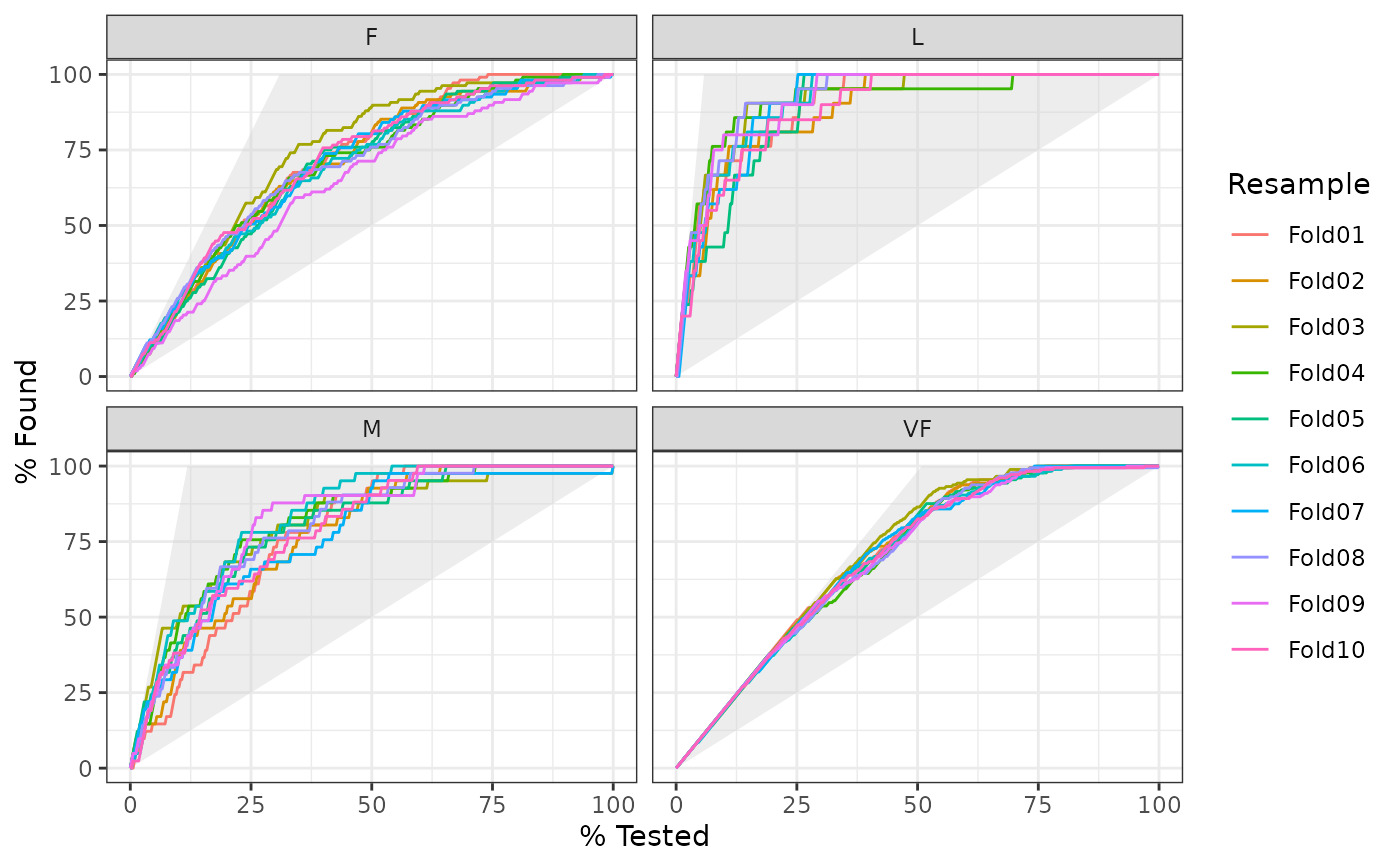
# Same as above, but will all of the resamples
# The resample with the minimum (farthest to the left) "perfect" value is
# used to draw the shaded region
hpc_cv %>%
  group_by(Resample) %>%
  gain_curve(obs, VF:L) %>%
  autoplot()

相关用法
- R yardstick gain_capture 增益捕获
- R yardstick pr_auc 查准率曲线下面积
- R yardstick accuracy 准确性
- R yardstick pr_curve 精确率召回曲线
- R yardstick conf_mat 分类数据的混淆矩阵
- R yardstick mn_log_loss 多项数据的平均对数损失
- R yardstick rpd 性能与偏差之比
- R yardstick mae 平均绝对误差
- R yardstick detection_prevalence 检测率
- R yardstick bal_accuracy 平衡的精度
- R yardstick rpiq 绩效与四分位间的比率
- R yardstick roc_aunp 使用先验类别分布,每个类别相对于其他类别的 ROC 曲线下面积
- R yardstick roc_curve 接收者算子曲线
- R yardstick rsq R 平方
- R yardstick msd 平均符号偏差
- R yardstick mpe 平均百分比误差
- R yardstick iic 相关性理想指数
- R yardstick recall 记起
- R yardstick roc_aunu 使用均匀类别分布,每个类别相对于其他类别的 ROC 曲线下面积
- R yardstick npv 阴性预测值
- R yardstick rmse 均方根误差
- R yardstick sens 灵敏度
- R yardstick rsq_trad R 平方 - 传统
- R yardstick poisson_log_loss 泊松数据的平均对数损失
- R yardstick ppv 阳性预测值
注:本文由纯净天空筛选整理自Max Kuhn等大神的英文原创作品 Gain curve。非经特殊声明,原始代码版权归原作者所有,本译文未经允许或授权,请勿转载或复制。
