用法:
Series.plot.box(by=None, **kwargs)制作 DataFrame 列的箱线图。
箱线图是一种通过四分位数以图形方式描绘数值数据组的方法。该框从数据的 Q1 到 Q3 四分位值延伸,在中位数 (Q2) 处有一条线。胡须从框的边延伸以显示数据的范围。晶须的位置默认设置为距离盒子边的 1.5*IQR (IQR = Q3 - Q1)。离群点是那些超过胡须末端的点。
有关详细信息,请参阅 Wikipedia 的 boxplot 条目。
使用此图表时需要考虑的一个问题是方框和胡须可以重叠,这在绘制小型数据集时很常见。
- by:字符串或序列
DataFrame 中要分组的列。
- **kwargs:
其他关键字记录在
DataFrame.plot()中。
matplotlib.axes.Axes或它们的 numpy.ndarray
参数:
返回:
例子:
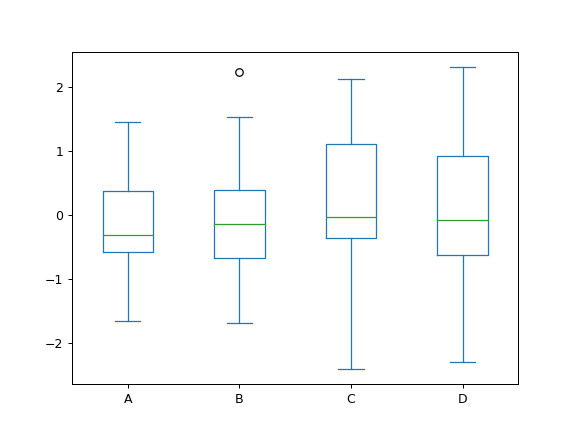
从具有四列随机生成数据的 DataFrame 中绘制箱形图。
>>> data = np.random.randn(25, 4)
>>> df = pd.DataFrame(data, columns=list('ABCD'))
>>> ax = df.plot.box()
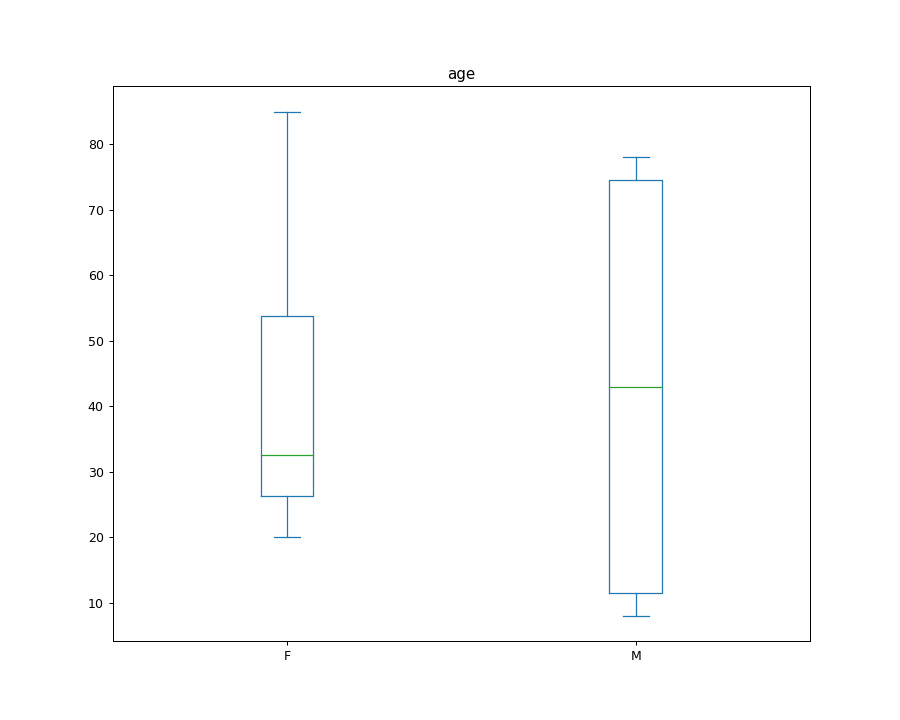
如果您指定
by参数(可以采用列名,或者列名的列表或元组),您还可以生成分组:>>> age_list = [8, 10, 12, 14, 72, 74, 76, 78, 20, 25, 30, 35, 60, 85] >>> df = pd.DataFrame({"gender": list("MMMMMMMMFFFFFF"), "age": age_list}) >>> ax = df.plot.box(column="age", by="gender", figsize=(10, 8))
相关用法
- Python pandas.Series.plot.bar用法及代码示例
- Python pandas.Series.plot.barh用法及代码示例
- Python pandas.Series.plot.line用法及代码示例
- Python pandas.Series.plot.hist用法及代码示例
- Python pandas.Series.plot.kde用法及代码示例
- Python pandas.Series.plot.pie用法及代码示例
- Python pandas.Series.plot.area用法及代码示例
- Python pandas.Series.plot.density用法及代码示例
- Python pandas.Series.pop用法及代码示例
- Python pandas.Series.pow用法及代码示例
- Python pandas.Series.product用法及代码示例
- Python pandas.Series.pipe用法及代码示例
- Python pandas.Series.pct_change用法及代码示例
- Python pandas.Series.prod用法及代码示例
- Python pandas.Series.add_prefix用法及代码示例
- Python pandas.Series.map用法及代码示例
- Python pandas.Series.max用法及代码示例
- Python pandas.Series.str.isdecimal用法及代码示例
- Python pandas.Series.str.get用法及代码示例
- Python pandas.Series.to_csv用法及代码示例
注:本文由纯净天空筛选整理自pandas.pydata.org大神的英文原创作品 pandas.Series.plot.box。非经特殊声明,原始代码版权归原作者所有,本译文未经允许或授权,请勿转载或复制。
