Python的Plotly库对于数据可视化和简单,轻松地理解数据非常有用。
figure_factory.create_dendrogram
树状图是表示树的图。名为create_dendrogram的图形工厂对数据执行分层聚类,并表示结果树。树深度轴上的值对应于群集之间的距离。
用法:plotly.figure_factory.create_dendrogram(X, orientation=’bottom’, labels=None, colorscale=None, distfun=None, linkagefun=<function <lambda>>, hovertext=None, color_threshold=None)
参数:
X((ndarray))-将观察矩阵描述为数组
方向((str))-在此我们使用‘top’,‘right’,‘bottom’或‘left’
标签((列表))-描述轴类别标签(观察标签)的列表
colorscale((list))-描述树状图树的可选色标
distfun((function))-描述从观测值计算成对距离的函数
linksfun((function))-描述从配对距离计算链接矩阵的函数
hovertext((list [list]))-它描述了树状图簇组成轨迹的悬浮文本列表
color_threshold((double))-它描述了集群分离的值
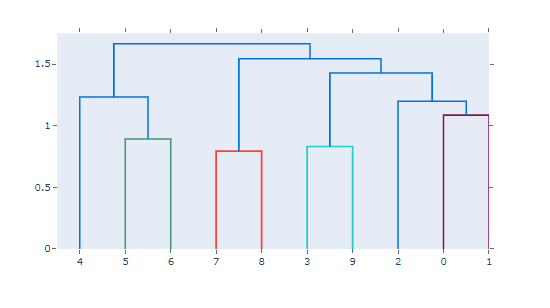
范例1:简单的底部定向树状图
Python3
from plotly.figure_factory import create_dendrogram
import numpy as np


X = np.random.rand(10,10)
fig = create_dendrogram(X)
fig.show()
输出:

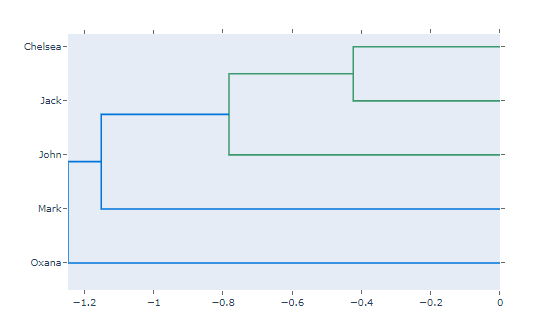
范例2:树状图放在热图的左侧
Python3
from plotly.figure_factory import create_dendrogram
import numpy as np


X = np.random.rand(5,5)
names = ['Jack', 'Oxana', 'John', 'Chelsea', 'Mark']

dendro = create_dendrogram(X, orientation='right', labels=names)
dendro.update_layout({'width':700, 'height':500})
dendro.show()
输出:

相关用法
- Python Wand function()用法及代码示例
- Python sum()用法及代码示例
- Python hex()用法及代码示例
- Python tell()用法及代码示例
- Python dir()用法及代码示例
- Python id()用法及代码示例
- Python map()用法及代码示例
- Python int()用法及代码示例
- Python cmp()用法及代码示例
- Python ord()用法及代码示例
- Python now()用法及代码示例
- Python oct()用法及代码示例
- Python str()用法及代码示例
- Python range()用法及代码示例
- Python math.gcd()用法及代码示例
- Python turtle.pen()用法及代码示例
注:本文由纯净天空筛选整理自deepanshumehra1410大神的英文原创作品 plotly.figure_factory.create_dendrogram() function in Python。非经特殊声明,原始代码版权归原作者所有,本译文未经允许或授权,请勿转载或复制。
