Python的Plotly庫對於數據可視化和簡單,輕鬆地理解數據非常有用。
figure_factory.create_dendrogram
樹狀圖是表示樹的圖。名為create_dendrogram的圖形工廠對數據執行分層聚類,並表示結果樹。樹深度軸上的值對應於群集之間的距離。
用法:plotly.figure_factory.create_dendrogram(X, orientation=’bottom’, labels=None, colorscale=None, distfun=None, linkagefun=<function <lambda>>, hovertext=None, color_threshold=None)
參數:
X((ndarray))-將觀察矩陣描述為數組
方向((str))-在此我們使用‘top’,‘right’,‘bottom’或‘left’
標簽((列表))-描述軸類別標簽(觀察標簽)的列表
colorscale((list))-描述樹狀圖樹的可選色標
distfun((function))-描述從觀測值計算成對距離的函數
linksfun((function))-描述從配對距離計算鏈接矩陣的函數
hovertext((list [list]))-它描述了樹狀圖簇組成軌跡的懸浮文本列表
color_threshold((double))-它描述了集群分離的值
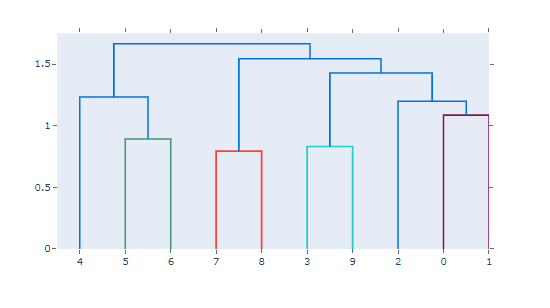
範例1:簡單的底部定向樹狀圖
Python3
from plotly.figure_factory import create_dendrogram
import numpy as np


X = np.random.rand(10,10)
fig = create_dendrogram(X)
fig.show()
輸出:

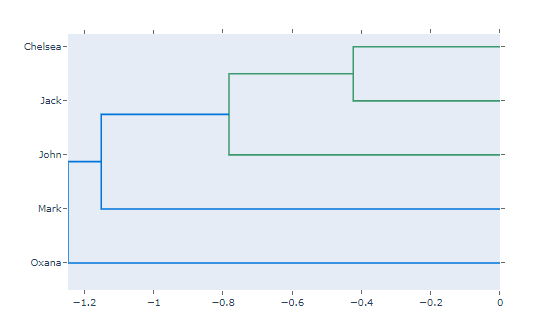
範例2:樹狀圖放在熱圖的左側
Python3
from plotly.figure_factory import create_dendrogram
import numpy as np


X = np.random.rand(5,5)
names = ['Jack', 'Oxana', 'John', 'Chelsea', 'Mark']

dendro = create_dendrogram(X, orientation='right', labels=names)
dendro.update_layout({'width':700, 'height':500})
dendro.show()
輸出:

相關用法
- Python Wand function()用法及代碼示例
- Python sum()用法及代碼示例
- Python hex()用法及代碼示例
- Python tell()用法及代碼示例
- Python dir()用法及代碼示例
- Python id()用法及代碼示例
- Python map()用法及代碼示例
- Python int()用法及代碼示例
- Python cmp()用法及代碼示例
- Python ord()用法及代碼示例
- Python now()用法及代碼示例
- Python oct()用法及代碼示例
- Python str()用法及代碼示例
- Python range()用法及代碼示例
- Python math.gcd()用法及代碼示例
- Python turtle.pen()用法及代碼示例
注:本文由純淨天空篩選整理自deepanshumehra1410大神的英文原創作品 plotly.figure_factory.create_dendrogram() function in Python。非經特殊聲明,原始代碼版權歸原作者所有,本譯文未經允許或授權,請勿轉載或複製。
