Python的Plotly库对于数据可视化和简单,轻松地理解数据非常有用。
figure_factory.create_choropleth
ChoroplethMap是由彩色多边形组成的Map。它用于表示数量的空间变化。
用法: plotly.figure_factory.create_choropleth(fips, values, scope=[‘usa’], binning_endpoints=None, colorscale=None, order=None, legend_title=”, **layout_options)
参数:
fips((list))-它描述了FIPS值的列表,这些值对应于州和县ID的组合。
值((列表))-这些值将确定县的颜色。
范围((列表))-描述状态列表和/或状态缩写。紧密适合相机中的所有状态。
binning_endpoints((list))-描述升序数字,隐式定义用作区间的实数间隔。
colorscale((list))-它是颜色列表,其长度等于颜色类别的数量。
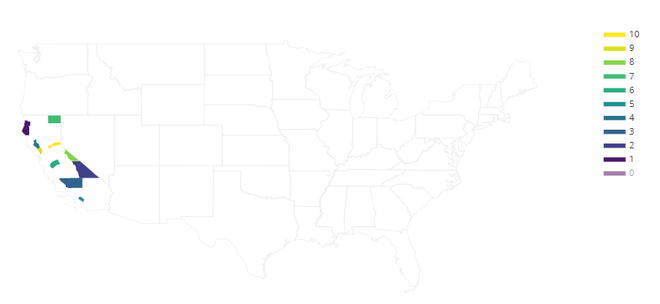
例:加利福尼亚州几个县的Choropleth
Python3
import plotly.figure_factory as ff

fips = ['06021', '06023', '06027',
        '06029', '06033', '06059',
        '06047', '06049', '06051',
        '06055', '06061']
values = range(len(fips))

fig = ff.create_choropleth(fips=fips, values=values)
fig.layout.template = None
fig.show()
输出:

相关用法
- Python Wand function()用法及代码示例
- Python sum()用法及代码示例
- Python hex()用法及代码示例
- Python tell()用法及代码示例
- Python dir()用法及代码示例
- Python id()用法及代码示例
- Python map()用法及代码示例
- Python int()用法及代码示例
- Python cmp()用法及代码示例
- Python ord()用法及代码示例
- Python now()用法及代码示例
- Python oct()用法及代码示例
- Python str()用法及代码示例
- Python range()用法及代码示例
- Python math.gcd()用法及代码示例
- Python turtle.pen()用法及代码示例
注:本文由纯净天空筛选整理自deepanshumehra1410大神的英文原创作品 plotly.figure_factory.create_choropleth() function in Python。非经特殊声明,原始代码版权归原作者所有,本译文未经允许或授权,请勿转载或复制。
