Python的Plotly庫對於數據可視化和簡單,輕鬆地理解數據非常有用。
figure_factory.create_choropleth
ChoroplethMap是由彩色多邊形組成的Map。它用於表示數量的空間變化。
用法: plotly.figure_factory.create_choropleth(fips, values, scope=[‘usa’], binning_endpoints=None, colorscale=None, order=None, legend_title=”, **layout_options)
參數:
fips((list))-它描述了FIPS值的列表,這些值對應於州和縣ID的組合。
值((列表))-這些值將確定縣的顏色。
範圍((列表))-描述狀態列表和/或狀態縮寫。緊密適合相機中的所有狀態。
binning_endpoints((list))-描述升序數字,隱式定義用作區間的實數間隔。
colorscale((list))-它是顏色列表,其長度等於顏色類別的數量。
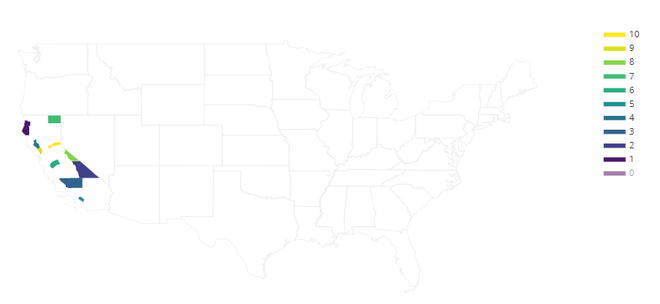
例:加利福尼亞州幾個縣的Choropleth
Python3
import plotly.figure_factory as ff

fips = ['06021', '06023', '06027',
        '06029', '06033', '06059',
        '06047', '06049', '06051',
        '06055', '06061']
values = range(len(fips))

fig = ff.create_choropleth(fips=fips, values=values)
fig.layout.template = None
fig.show()
輸出:

相關用法
- Python Wand function()用法及代碼示例
- Python sum()用法及代碼示例
- Python hex()用法及代碼示例
- Python tell()用法及代碼示例
- Python dir()用法及代碼示例
- Python id()用法及代碼示例
- Python map()用法及代碼示例
- Python int()用法及代碼示例
- Python cmp()用法及代碼示例
- Python ord()用法及代碼示例
- Python now()用法及代碼示例
- Python oct()用法及代碼示例
- Python str()用法及代碼示例
- Python range()用法及代碼示例
- Python math.gcd()用法及代碼示例
- Python turtle.pen()用法及代碼示例
注:本文由純淨天空篩選整理自deepanshumehra1410大神的英文原創作品 plotly.figure_factory.create_choropleth() function in Python。非經特殊聲明,原始代碼版權歸原作者所有,本譯文未經允許或授權,請勿轉載或複製。
