Python的Plotly库对于数据可视化和简单,轻松地理解数据非常有用。
figure_factory.create_annotated_heatmap
创建带注释的热图并将注释添加到热图的每个单元格的函数。
用法:plotly.figure_factory.create_annotated_heatmap(z, x=None, y=None, annotation_text=None, colorscale=’Plasma’, font_colors=None, showscale=False, reversescale=False, **kwargs)
参数:
z((list [list] | ndarray))-描述创建热图的z矩阵。
x((list))-描述x轴标签。
y((list))-描述y轴标签。annotation_text((list [list] | ndarray))-注释的文本字符串。应具有与z矩阵相同的尺寸。如果未添加任何文本,则将标注z矩阵的值。默认值= z矩阵值。
色标((list | str))-描述热图色标。
font_colors((list))-描述两个颜色字符串的列表:[min_text_color,max_text_color]
showscale((bool))-显示色标,默认为False
reversescale((bool))-使用默认值为False反转颜色比例
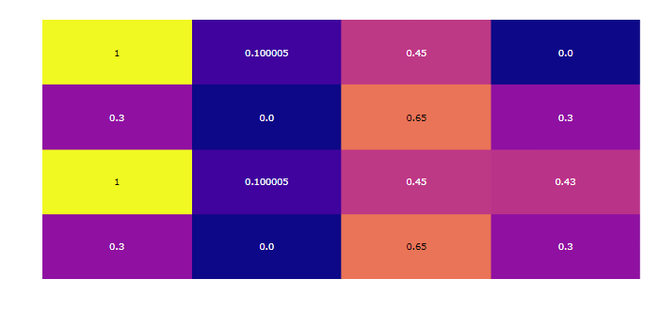
范例1:具有默认配置的简单带注释的热图
Python3
import plotly.figure_factory as ff


z = [[0.300000, 0.00000, 0.65, 0.300000],
     [1, 0.100005, 0.45, 0.4300],
     [0.300000, 0.00000, 0.65, 0.300000],
     [1, 0.100005, 0.45, 0.00000]]
fig = ff.create_annotated_heatmap(z)
fig.show()
输出:

范例2:定义的色阶
Python3
import plotly.figure_factory as ff

z = [[.1, .3, .5, .7],
     [1, .8, .6, .4],
     [.6, .4, .2, .0],
     [.9, .7, .5, .3]]

fig = ff.create_annotated_heatmap(z, colorscale='Viridis')
fig.show()
输出:

相关用法
- Python Wand function()用法及代码示例
- Python dir()用法及代码示例
- Python id()用法及代码示例
- Python int()用法及代码示例
- Python hex()用法及代码示例
- Python str()用法及代码示例
- Python tell()用法及代码示例
- Python cmp()用法及代码示例
- Python now()用法及代码示例
- Python map()用法及代码示例
- Python oct()用法及代码示例
- Python ord()用法及代码示例
- Python sum()用法及代码示例
- Python math.gcd()用法及代码示例
- Python math.cos()用法及代码示例
- Python ldexp()用法及代码示例
- Python fmod()用法及代码示例
注:本文由纯净天空筛选整理自deepanshumehra1410大神的英文原创作品 plotly.figure_factory.create_annotated_heatmap() function in Python。非经特殊声明,原始代码版权归原作者所有,本译文未经允许或授权,请勿转载或复制。
