Python的Plotly庫對於數據可視化和簡單,輕鬆地理解數據非常有用。
figure_factory.create_annotated_heatmap
創建帶注釋的熱圖並將注釋添加到熱圖的每個單元格的函數。
用法:plotly.figure_factory.create_annotated_heatmap(z, x=None, y=None, annotation_text=None, colorscale=’Plasma’, font_colors=None, showscale=False, reversescale=False, **kwargs)
參數:
z((list [list] | ndarray))-描述創建熱圖的z矩陣。
x((list))-描述x軸標簽。
y((list))-描述y軸標簽。annotation_text((list [list] | ndarray))-注釋的文本字符串。應具有與z矩陣相同的尺寸。如果未添加任何文本,則將標注z矩陣的值。默認值= z矩陣值。
色標((list | str))-描述熱圖色標。
font_colors((list))-描述兩個顏色字符串的列表:[min_text_color,max_text_color]
showscale((bool))-顯示色標,默認為False
reversescale((bool))-使用默認值為False反轉顏色比例
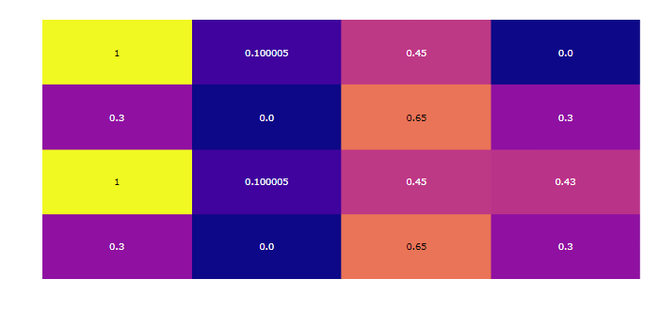
範例1:具有默認配置的簡單帶注釋的熱圖
Python3
import plotly.figure_factory as ff


z = [[0.300000, 0.00000, 0.65, 0.300000],
     [1, 0.100005, 0.45, 0.4300],
     [0.300000, 0.00000, 0.65, 0.300000],
     [1, 0.100005, 0.45, 0.00000]]
fig = ff.create_annotated_heatmap(z)
fig.show()
輸出:

範例2:定義的色階
Python3
import plotly.figure_factory as ff

z = [[.1, .3, .5, .7],
     [1, .8, .6, .4],
     [.6, .4, .2, .0],
     [.9, .7, .5, .3]]

fig = ff.create_annotated_heatmap(z, colorscale='Viridis')
fig.show()
輸出:

相關用法
- Python Wand function()用法及代碼示例
- Python dir()用法及代碼示例
- Python id()用法及代碼示例
- Python int()用法及代碼示例
- Python hex()用法及代碼示例
- Python str()用法及代碼示例
- Python tell()用法及代碼示例
- Python cmp()用法及代碼示例
- Python now()用法及代碼示例
- Python map()用法及代碼示例
- Python oct()用法及代碼示例
- Python ord()用法及代碼示例
- Python sum()用法及代碼示例
- Python math.gcd()用法及代碼示例
- Python math.cos()用法及代碼示例
- Python ldexp()用法及代碼示例
- Python fmod()用法及代碼示例
注:本文由純淨天空篩選整理自deepanshumehra1410大神的英文原創作品 plotly.figure_factory.create_annotated_heatmap() function in Python。非經特殊聲明,原始代碼版權歸原作者所有,本譯文未經允許或授權,請勿轉載或複製。
