因子分析也称为探索性因子分析,是 R 编程中使用的一种统计技术,用于识别不活动的关系结构,并进一步将变量池缩小到少数变量。使用这种技术的主要动机是找出哪个因子对权重分类的影响最大。
用法: factanal(x, factors)
参数:
x:表示数据集
factors:指定要拟合的因子数
例:
让我们假设,数据集中有许多食物及其食物质地数据点,例如油、密度、脆皮、断裂和硬度。
# Reading csv file of food textures
food_textures <- read.csv("https://userpage.fu-berlin.de/soga/300/30100_data_sets/food-texture.csv")

food_textures <- food_textures[, 2:6]

factor_analysis <- factanal(food_textures, factors = 2)

print(factor_analysis)

# Output to be present as PNG file
png(file = "factorAnalysisGFG.png")

# Plot factor 1 by factor 2
load <- factor_analysis$loadings[, 1:2]

# Plot graph
plot(load, type = "n")
text(load, labels = names(food_textures), cex = .9)

# Saving the file
dev.off()
输出:
Call:
factanal(x = food_textures, factors = 2)

Uniquenesses:
     Oil  Density   Crispy Fracture Hardness
   0.334    0.156    0.042    0.256    0.407

Loadings:
         Factor1 Factor2
Oil      -0.816
Density   0.919
Crispy   -0.745   0.635
Fracture  0.645  -0.573
Hardness          0.764

               Factor1 Factor2
SS loadings      2.490   1.316
Proportion Var   0.498   0.263
Cumulative Var   0.498   0.761

Test of the hypothesis that 2 factors are sufficient.
The chi-square statistic is 0.27 on 1 degree of freedom.
The p-value is 0.603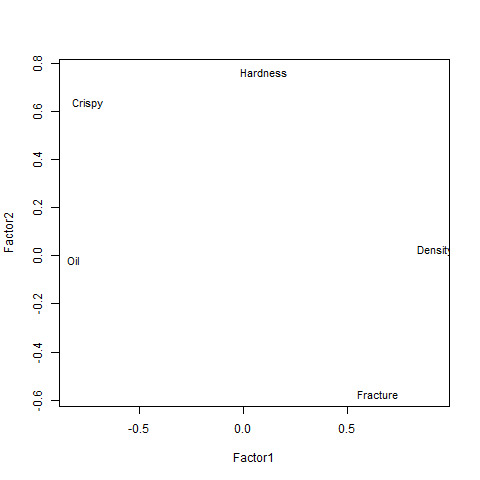
相关用法
- R语言 is.factor()用法及代码示例
- R语言 as.factor()用法及代码示例
- R语言 as.ordered()用法及代码示例
- R语言 is.ordered()用法及代码示例
- R语言 levels()用法及代码示例
- R语言 recode_factor()用法及代码示例
- R语言 droplevels()用法及代码示例
- R语言 nlevels()用法及代码示例
- R语言 outer()用法及代码示例
- R语言 mapply()用法及代码示例
- R语言 lm()用法及代码示例
- R语言 binom.test()用法及代码示例
注:本文由纯净天空筛选整理自utkarsh_kumar大神的英文原创作品 Performing Analysis of a Factor in R Programming – factanal() Function。非经特殊声明,原始代码版权归原作者所有,本译文未经允许或授权,请勿转载或复制。