因子分析也稱為探索性因子分析,是 R 編程中使用的一種統計技術,用於識別不活動的關係結構,並進一步將變量池縮小到少數變量。使用這種技術的主要動機是找出哪個因子對權重分類的影響最大。
用法: factanal(x, factors)
參數:
x:表示數據集
factors:指定要擬合的因子數
例:
讓我們假設,數據集中有許多食物及其食物質地數據點,例如油、密度、脆皮、斷裂和硬度。
# Reading csv file of food textures
food_textures <- read.csv("https://userpage.fu-berlin.de/soga/300/30100_data_sets/food-texture.csv")

food_textures <- food_textures[, 2:6]

factor_analysis <- factanal(food_textures, factors = 2)

print(factor_analysis)

# Output to be present as PNG file
png(file = "factorAnalysisGFG.png")

# Plot factor 1 by factor 2
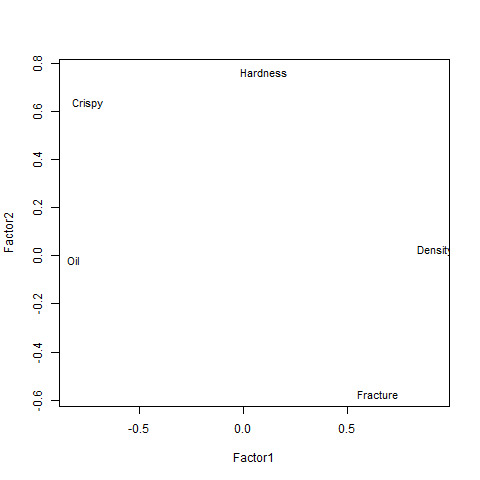
load <- factor_analysis$loadings[, 1:2]

# Plot graph
plot(load, type = "n")
text(load, labels = names(food_textures), cex = .9)

# Saving the file
dev.off()
輸出:
Call:
factanal(x = food_textures, factors = 2)

Uniquenesses:
     Oil  Density   Crispy Fracture Hardness
   0.334    0.156    0.042    0.256    0.407

Loadings:
         Factor1 Factor2
Oil      -0.816
Density   0.919
Crispy   -0.745   0.635
Fracture  0.645  -0.573
Hardness          0.764

               Factor1 Factor2
SS loadings      2.490   1.316
Proportion Var   0.498   0.263
Cumulative Var   0.498   0.761

Test of the hypothesis that 2 factors are sufficient.
The chi-square statistic is 0.27 on 1 degree of freedom.
The p-value is 0.603
相關用法
- R語言 is.factor()用法及代碼示例
- R語言 as.factor()用法及代碼示例
- R語言 as.ordered()用法及代碼示例
- R語言 is.ordered()用法及代碼示例
- R語言 levels()用法及代碼示例
- R語言 recode_factor()用法及代碼示例
- R語言 droplevels()用法及代碼示例
- R語言 nlevels()用法及代碼示例
- R語言 outer()用法及代碼示例
- R語言 mapply()用法及代碼示例
- R語言 lm()用法及代碼示例
- R語言 binom.test()用法及代碼示例
注:本文由純淨天空篩選整理自utkarsh_kumar大神的英文原創作品 Performing Analysis of a Factor in R Programming – factanal() Function。非經特殊聲明,原始代碼版權歸原作者所有,本譯文未經允許或授權,請勿轉載或複製。
