在 R 编程中,qunif()函数给出均匀分布上的分位数函数值。
用法:
qunif(p, min, max, lower.tail = TRUE, log.p = FALSE)
参数:
p:表示概率向量
min, max:表示分布的下限和上限
下尾:表示逻辑值。如果为 TRUE,则概率为 P[Xx]
日志.p:表示逻辑值。如果为 TRUE,则概率以 log(p) 形式给出
范例1:
# R program to find the value of
# Quantile Function

# Creating a vector
x <- seq(0, 1, by = 0.2)

# qunif() function
qunif(x, min = 2, max = 6)
输出:
[1] 2.0 2.8 3.6 4.4 5.2 6.0
范例2:
# Create variables
x <- seq(0, 1, by = 0.02)
y <- qunif(x, min = 1, max = 5)

# Output to be present as PNG file
png(file = "qunifGFG.png")

# Plot
plot(y, type = "o")

# Saving the file
dev.off()
输出: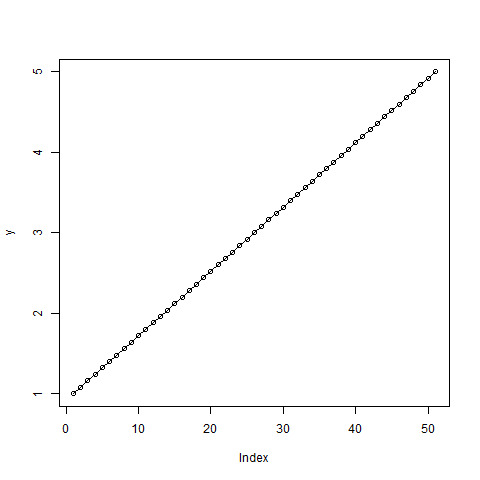
相关用法
- R语言 qf()用法及代码示例
- R语言 qweibull()用法及代码示例
- R语言 qtukey()用法及代码示例
- R语言 qsignrank()用法及代码示例
- R语言 qwilcox()用法及代码示例
- R语言 punif()用法及代码示例
- R语言 ptukey()用法及代码示例
- R语言 dsignrank()用法及代码示例
- R语言 psignrank()用法及代码示例
- R语言 dwilcox()用法及代码示例
- R语言 pwilcox()用法及代码示例
- R语言 qcauchy()用法及代码示例
- R语言 qlogis()用法及代码示例
- R语言 qlnorm()用法及代码示例
- R语言 qpois()用法及代码示例
- R语言 qnbinom()用法及代码示例
- R语言 qgeom()用法及代码示例
- R语言 qchisq()用法及代码示例
- R语言 runif()用法及代码示例
- R语言 ecdf()用法及代码示例
- R语言 pf()用法及代码示例
- R语言 dunif()用法及代码示例
注:本文由纯净天空筛选整理自utkarsh_kumar大神的英文原创作品 Compute the Value of Quantile Function over Uniform Distribution in R Programming – qunif() Function。非经特殊声明,原始代码版权归原作者所有,本译文未经允许或授权,请勿转载或复制。