runif()R语言中的函数用于创建均匀分布的随机偏差。
用法: runif(n, min, max)
参数:
n:表示观察次数
min, max:表示分布的下限和上限
范例1:
# Create uniform distribution between range -1 to 1
x <- runif(20, min = -1, max = 1)

# Print distibution
print(x)
输出:
 [1]  0.90453974 -0.97083088  0.83531295  0.19008941  0.52278078 -0.75730955
 [7]  0.21659920 -0.26621211  0.11967620  0.42081991  0.75518470 -0.41519833
[13] -0.03734007  0.57365077  0.76156708  0.97314141 -0.41957919 -0.08910355
[19]  0.29047038 -0.67069856
范例2:
# Create uniform distribution of range -5 to 5
unif <- runif(10000, min = -5, max = 5)

# Output to be present as PNG file
png(file = "runifGFG.png")

# Create Histogram
hist(unif, freq = FALSE,
     xlab = 'x',
     ylim = c(0, 0.4),
     xlim = c(-6, 6),
     density = 20,
     main = "Uniform distribution for the interval [-5, 5]")

# Show density of distribution using curve
curve(dunif(x, min = -5, max = 5),
      from = -10, to = 10,
      n = 100000,
      col = "darkgreen",
      lwd = 2,
      add = TRUE,
      yaxt = "n",
      ylab = 'probability')

# Saving the file
dev.off()
输出: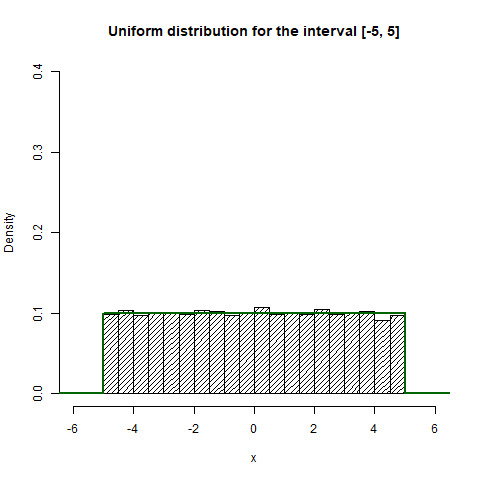
相关用法
- R语言 qunif()用法及代码示例
- R语言 punif()用法及代码示例
- R语言 dunif()用法及代码示例
- R语言 ecdf()用法及代码示例
- R语言 pf()用法及代码示例
- R语言 qf()用法及代码示例
- R语言 qweibull()用法及代码示例
- R语言 qtukey()用法及代码示例
- R语言 qsignrank()用法及代码示例
- R语言 qwilcox()用法及代码示例
- R语言 ptukey()用法及代码示例
- R语言 dsignrank()用法及代码示例
- R语言 psignrank()用法及代码示例
- R语言 dwilcox()用法及代码示例
- R语言 pwilcox()用法及代码示例
- R语言 dgeom()用法及代码示例
注:本文由纯净天空筛选整理自utkarsh_kumar大神的英文原创作品 Create Random Deviates of Uniform Distribution in R Programming – runif() Function。非经特殊声明,原始代码版权归原作者所有,本译文未经允许或授权,请勿转载或复制。