scipy.stats.frechet_l()是Frechet左(或Weibull最大值)連續隨機變量,使用標準格式和一些形狀參數進行定義以完成其規格。
![]()
參數:
-> q :上下尾概率
-> a :形狀參數
-> x :分位數
-> loc :[可選]位置參數。默認值= 0
-> scale:[可選]比例參數。默認值= 1
-> size :[int型元組,可選]形狀或隨機變量。
-> moments:[可選]由字母['mvsk']組成; “ m” =均值,“ v” =方差,
“ s” = Fisher的歪斜,“ k” = Fisher的峰度。 (默認=“ MV”)。
Results:Frechet左連續隨機變量
代碼1:創建Frechet左連續隨機變量
from scipy.stats import frechet_l

numargs = frechet_l .numargs
[a] = [0.7, ] * numargs
rv = frechet_l (a)

print ("RV:\n", rv)
輸出:
RV:
 <scipy.stats._distn_infrastructure.rv_frozen object at 0x0000018D578BC9E8>
代碼2:Frechet左隨機變量和概率分布。
import numpy as np
quantile = np.arange (0.01, 1, 0.1)

# Random Variates
R = frechet_l.rvs(a, scale = 2,  size = 10)
print ("Random Variates:\n", R)

# PDF
R = frechet_l.pdf(a, quantile, loc = 0, scale = 1)
print ("\nProbability Distribution:\n", R)
輸出:
Random Variates:
 [-4.66775585e-02 -3.75425255e+00 -2.32248407e-01 -1.20807347e-03
 -6.26373883e+00 -1.14007755e+00 -5.09499683e+00 -4.18191271e-01
 -4.33720753e+00 -1.05442843e+00]

Probability Distribution:
 [0. 0. 0. 0. 0. 0. 0. 0. 0. 0.]
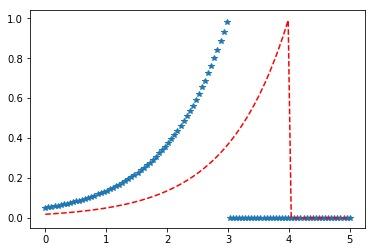
代碼3:更改位置參數
import matplotlib.pyplot as plt
import numpy as np

x = np.linspace(0, 5, 100)

# Varying positional arguments
y1 = frechet_l.pdf(x, 1, 3)
y2 = frechet_l.pdf(x, 1, 4)
plt.plot(x, y1, "*", x, y2, "r--")
輸出:

相關用法
- Python Scipy stats.chi()用法及代碼示例
- Python Scipy stats.f()用法及代碼示例
- Python Scipy stats.exponpow()用法及代碼示例
- Python Scipy stats.percentileofscore()用法及代碼示例
- Python Scipy stats.exponweib()用法及代碼示例
- Python Scipy stats.bradford()用法及代碼示例
- Python Scipy stats.halflogistic()用法及代碼示例
- Python Scipy stats.fatiguelife()用法及代碼示例
- Python Scipy stats.gompertz()用法及代碼示例
- Python Scipy stats.skew()用法及代碼示例
- Python Scipy stats.sem()用法及代碼示例
- Python Scipy stats.halfnorm()用法及代碼示例
- Python Scipy stats.fisk()用法及代碼示例
- Python Scipy stats.beta()用法及代碼示例
- Python Scipy stats.cosine()用法及代碼示例
注:本文由純淨天空篩選整理自vishal3096大神的英文原創作品 scipy stats.frechet_l() | Python。非經特殊聲明,原始代碼版權歸原作者所有,本譯文未經允許或授權,請勿轉載或複製。
