scipy.stats.halfnorm()是半標準連續隨機變量,使用標準格式和一些形狀參數定義該變量以完成其規格。

參數:
-> q :上下尾概率
-> x :分位數
-> loc :[可選]位置參數。默認值= 0
-> scale:[可選]比例參數。默認值= 1
-> size :[int型元組,可選]形狀或隨機變量。
-> moments:[可選]由字母['mvsk']組成; “ m” =均值,“ v” =方差,“ s” = Fisher的偏度,“ k” = Fisher的峰度。 (默認=“ MV”)。
Results:半正態連續隨機變量
代碼1:創建半正常連續隨機變量
from scipy.stats import halfnorm

numargs = halfnorm.numargs
[] = [0.7, ] * numargs
rv = halfnorm()

print ("RV:\n", rv)
輸出:
RV:
 <scipy.stats._distn_infrastructure.rv_frozen object at 0x000001E39B53B630>
代碼2:半正態隨機變量和概率分布
import numpy as np
quantile = np.arange (0.01, 1, 0.1)

# Random Variates
R = halfnorm.rvs(scale = 2,  size = 10)
print ("Random Variates:\n", R)

# PDF
R = halfnorm.pdf(quantile, loc = 0, scale = 1)
print ("\nProbability Distribution:\n", R)
輸出:
Random Variates:
 [3.95023511 1.97013912 2.00977927 1.88217027 2.24680027 0.7298033
 0.56769996 0.62071753 1.74743798 0.35512999]

Probability Distribution:
 [0.79784467 0.79307193 0.78048376 0.76045271 0.73356332 0.70058376
 0.66242936 0.62012057 0.57473779 0.52737608]
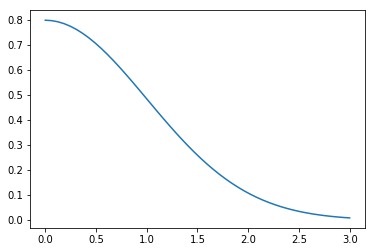
代碼3:圖形表示。
import numpy as np
import matplotlib.pyplot as plt

distribution = np.linspace(0, np.minimum(rv.dist.b, 3))
print("Distribution:\n", distribution)

plot = plt.plot(distribution, rv.pdf(distribution))
輸出:
Distribution:
 [0.         0.06122449 0.12244898 0.18367347 0.24489796 0.30612245
 0.36734694 0.42857143 0.48979592 0.55102041 0.6122449  0.67346939
 0.73469388 0.79591837 0.85714286 0.91836735 0.97959184 1.04081633
 1.10204082 1.16326531 1.2244898  1.28571429 1.34693878 1.40816327
 1.46938776 1.53061224 1.59183673 1.65306122 1.71428571 1.7755102
 1.83673469 1.89795918 1.95918367 2.02040816 2.08163265 2.14285714
 2.20408163 2.26530612 2.32653061 2.3877551  2.44897959 2.51020408
 2.57142857 2.63265306 2.69387755 2.75510204 2.81632653 2.87755102
 2.93877551 3.        ]

代碼4:更改位置參數
import matplotlib.pyplot as plt
import numpy as np

x = np.linspace(0, 5, 100)

# Varying positional arguments
y1 = halfnorm.pdf(x, 1, 3)
y2 = halfnorm.pdf(x, 1, 4)
plt.plot(x, y1, "*", x, y2, "r--")
輸出:

相關用法
- Python Scipy stats.chi()用法及代碼示例
- Python Scipy stats.f()用法及代碼示例
- Python Scipy stats.exponpow()用法及代碼示例
- Python Scipy stats.percentileofscore()用法及代碼示例
- Python Scipy stats.exponweib()用法及代碼示例
- Python Scipy stats.bradford()用法及代碼示例
- Python Scipy stats.halflogistic()用法及代碼示例
- Python Scipy stats.fatiguelife()用法及代碼示例
- Python Scipy stats.gompertz()用法及代碼示例
- Python Scipy stats.skew()用法及代碼示例
- Python Scipy stats.sem()用法及代碼示例
- Python Scipy stats.fisk()用法及代碼示例
- Python Scipy stats.beta()用法及代碼示例
- Python Scipy stats.cosine()用法及代碼示例
- Python Scipy stats.arcsine()用法及代碼示例
注:本文由純淨天空篩選整理自vishal3096大神的英文原創作品 scipy stats.halfnorm() | Python。非經特殊聲明,原始代碼版權歸原作者所有,本譯文未經允許或授權,請勿轉載或複製。
