Matplotlib是Python中令人驚歎的可視化庫,用於數組的二維圖。 Matplotlib是一個基於NumPy數組的多平台數據可視化庫,旨在與更廣泛的SciPy堆棧配合使用。
matplotlib.ticker.FuncFormatter
這個 matplotlib.ticker.FuncFormatter類使用用戶定義的函數進行格式化。此用戶定義的函數必須將兩個值用作刻度值x和位置pos的輸入。
用法: class matplotlib.ticker.FuncFormatter(func)
參數:
- func:用戶定義的函數,用於格式化圖。
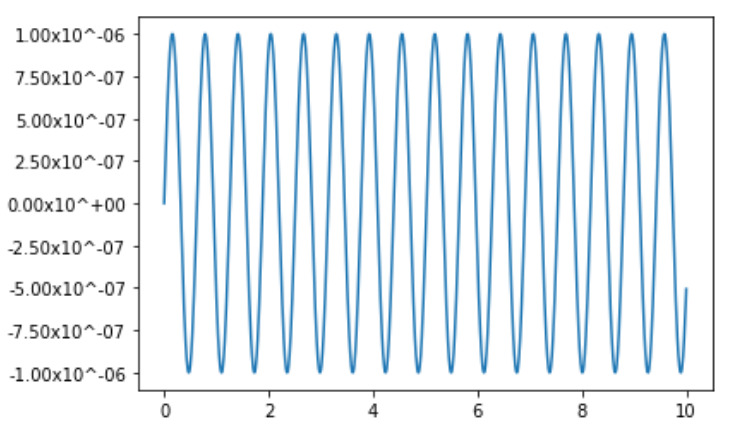
範例1:
import matplotlib.pyplot as plt
import matplotlib.ticker as tick
import numpy as np


x = np.linspace(0, 10, 1000)
y = 0.000001 * np.sin(10 * x)

fig = plt.figure()
ax = fig.add_subplot(111)

ax.plot(x, y)

def y_fmt(x, y):
    return '{:2.2e}'.format(x).replace('e', 'x10^')

ax.yaxis.set_major_formatter(tick.FuncFormatter(y_fmt))

plt.show()
輸出:
範例2:
import matplotlib.pyplot as plt
from matplotlib.ticker import FuncFormatter


fig, ax = plt.subplots()
ax.axis([0.01, 10000, 1, 1000000])
ax.loglog()

for axis in [ax.xaxis, ax.yaxis]:
    formatter = FuncFormatter(lambda y, _:'{:.16g}'.format(y))
    axis.set_major_formatter(formatter)

plt.show()
輸出:

相關用法
- Python Matplotlib.ticker.MultipleLocator用法及代碼示例
- Python Matplotlib.gridspec.GridSpec用法及代碼示例
- Python Matplotlib.patches.CirclePolygon用法及代碼示例
- Python Matplotlib.colors.Normalize用法及代碼示例
注:本文由純淨天空篩選整理自RajuKumar19大神的英文原創作品 Matplotlib.ticker.FuncFormatter class in Python。非經特殊聲明,原始代碼版權歸原作者所有,本譯文未經允許或授權,請勿轉載或複製。