Matplotlib是Python中令人驚歎的可視化庫,用於數組的二維圖。 Matplotlib是一個基於NumPy數組的多平台數據可視化庫,旨在與更廣泛的SciPy堆棧配合使用。
matplotlib.ticker.FixedLocator
這個 matplotlib.ticker.FixedLocator類是的子類matplotlib.ticker.Locator類,用於固定刻度位置。如果nbins的值不等於None,那麽所有可能位置的數組將為sub-sampled,以使滴答聲的總數小於或等於nbins +1。sub-sampling的作用是包含最小的絕對值。例如,如果可能值數組中包含零,則它保證選擇的刻度。
用法: class matplotlib.ticker.FixedLocator(locs, nbins=None)
參數:
- locs:它代表刻度線的位置。
- nbins:它代表數據將要劃分的倉數。
該類的方法:
- set_params(self,nbins = None):它用於在定位器中設置參數。
- tick_value(self,vmin,vmax):它返回vmax和vmin之間的刻度位置。
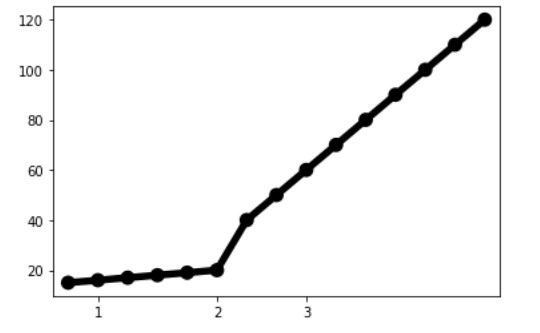
範例1:
import numpy as np
import matplotlib.pyplot as plt
import matplotlib


np.arange(0, 15, 5)
plt.figure(figsize = [6,4])

x = np.array([1, 2, 3, 4, 5,
              6, 7, 8, 9, 10,
              11, 12, 13, 14, 15])

y = np.array([15, 16, 17, 18,
              19, 20, 40, 50,
              60, 70, 80, 90,
              100, 110, 120])

ax = sns.pointplot(x, y,
                   color = 'k',
                   markers = ["."],
                   scale = 2)

ax.xaxis.set_major_locator(matplotlib.ticker.FixedLocator([1,5,8]))

plt.show()
輸出:
範例2:
import matplotlib.pyplot as plt
import numpy as np
import matplotlib.ticker


t = np.arange(0.0, 100.0, 0.1)
s = np.sin(0.1 * np.pi * t)*np.exp(-t * 0.01)

fig, ax = plt.subplots()
plt.plot(t, s)

ax1 = ax.twiny()
ax1.plot(t, s)

ax1.xaxis.set_ticks_position('bottom')

majors = np.linspace(0, 100, 6)
minors = np.linspace(0, 100, 11)
thirds = np.linspace(0, 100, 101)

ax.xaxis.set_major_locator(matplotlib.ticker.FixedLocator(majors))
ax.xaxis.set_minor_locator(matplotlib.ticker.FixedLocator(minors))
ax1.xaxis.set_major_locator(matplotlib.ticker.FixedLocator([]))
ax1.xaxis.set_minor_locator(matplotlib.ticker.FixedLocator(thirds))

ax1.tick_params(which ='minor', length = 2)
ax.tick_params(which ='minor', length = 4)
ax.tick_params(which ='major', length = 6)

ax.grid(which ='both', axis ='x', linestyle ='--')

plt.axhline(color ='green')

plt.show()
輸出:

相關用法
- Python Matplotlib.ticker.MultipleLocator用法及代碼示例
- Python Matplotlib.gridspec.GridSpec用法及代碼示例
- Python Matplotlib.patches.CirclePolygon用法及代碼示例
- Python Matplotlib.colors.Normalize用法及代碼示例
注:本文由純淨天空篩選整理自RajuKumar19大神的英文原創作品 Matplotlib.ticker.FixedLocator Class in Python。非經特殊聲明,原始代碼版權歸原作者所有,本譯文未經允許或授權,請勿轉載或複製。