Matplotlib是Python中令人驚歎的可視化庫,用於數組的二維圖。 Matplotlib是一個基於NumPy數組的多平台數據可視化庫,旨在與更廣泛的SciPy堆棧配合使用。
matplotlib.patches.RegularPolygon
這個matplotlib.patches.RegularPolygon類用於添加常規多邊形麵片。
用法: class matplotlib.patches.RegularPolygon(xy, numVertices, radius=5, orientation=0, **kwargs)
參數:
- xy:中心的長度2個元組(x,y)。
- numVertices:它表示頂點數。
- radius:從中心到每個頂點的距離。
- orientation:用於旋轉多邊形(以弧度為單位)。
下表列出了有效的kwarg;
| PROPERTY | DESCRIPTION |
|---|---|
| agg_filter | 一個過濾器函數,它接受一個(m,n,3)浮點數組,一個dpi值返回一個(m,n,3)數組 |
| alpha | 浮點數或無 |
| animated | bool |
| 抗鋸齒或抗鋸齒 | unknown |
| capstyle | {‘butt’,“回合”,‘projecting’} |
| clip_box | Bbox |
| clip_on | bool |
| clip_path | [(Path,Transform)|補丁|無] |
| color | rgba元組的顏色或順序 |
| contains | callable |
| edgecolor或ec或edgecolors | 顏色或無或‘auto’ |
| facecolor或fc或facecolors | 顏色或無 |
| figure | figure |
| fill | bool |
| gid | str |
| hatch | {‘/’、‘\’、‘|’、‘-’、‘+’、‘x’, ‘o’、‘O’、‘.’、‘*’} |
| in_layout | bool |
| joinstyle | {‘miter’,“回合”,‘bevel’} |
| 線型或ls | {“-”,“-”,“-。”,“:”,“,(偏移量,on-off-seq),...} |
| 線寬或線寬或lw | 浮點數或無 |
| path_effects | AbstractPathEffect |
| picker | 無或布爾或浮點數或可贖回 |
| path_effects | AbstractPathEffect |
| picker | float或callable [[Artist,Event],Tuple [bool,dict]] |
| rasterized | 布爾還是無 |
| sketch_params | (比例:浮點數,長度:浮點數,隨機性:浮點數) |
| snap | 布爾還是無 |
| transform | matplotlib.transforms.Transform |
| url | str |
| visible | bool |
| zorder | float |
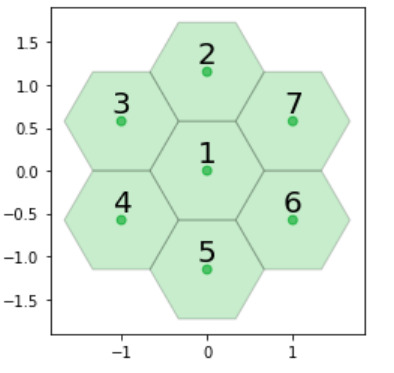
範例1:
import matplotlib.pyplot as plt
from matplotlib.patches import RegularPolygon
import numpy as np


coord = [[0, 0, 0],
         [0, 1, -1],
         [-1, 1, 0],
         [-1, 0, 1],
         [0, -1, 1],
         [1, -1, 0],
         [1, 0, -1]]

colors = [["Green"],
          ["Green"],
          ["Green"],
          ["Green"],
          ["Green"],
          ["Green"],
          ["Green"]]

labels = [['1'], ['2'],
          ['3'], ['4'],
          ['5'], ['6'],
          ['7']]

# Horizontal cartesian coords
hcoord =  for c in coord]

# Vertical cartersian coords
vcoord = [2. * np.sin(np.radians(60)) * (c[1] - c[2]) /3.
          for c in coord]

fig, ax = plt.subplots(1)
ax.set_aspect('equal')

# Add some coloured hexagons
for x, y, c, l in zip(hcoord, vcoord, colors, labels):

    # matplotlib understands lower
    # case words for colours
    color = c[0].lower()
    hex = RegularPolygon((x, y),
                         numVertices = 6,
                         radius = 2. / 3.,
                         orientation = np.radians(30),
                         facecolor = color,
                         alpha = 0.2,
                         edgecolor ='k')

    ax.add_patch(hex)

    # Also add a text label
    ax.text(x, y + 0.2, l[0], ha ='center',
            va ='center', size = 20)

# add scatter points in hexagon centres
ax.scatter(hcoord, vcoord, c =.lower()
                               for c in colors],
           alpha = 0.5)

plt.show()
輸出:
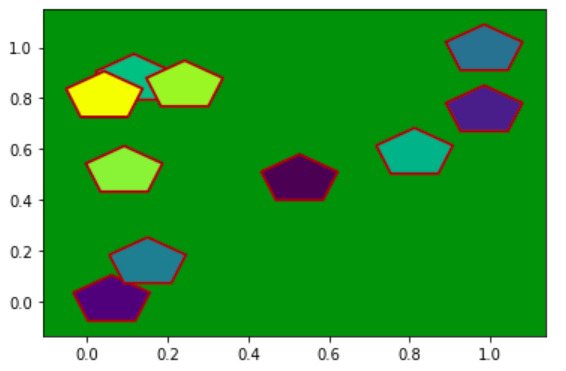
範例2:
import matplotlib.pyplot as plt
from matplotlib.patches import RegularPolygon
from matplotlib.collections import PatchCollection
import numpy as np


xy = np.random.random((10, 2))
z = np.random.random(10)

patches = [RegularPolygon((x, y),
                          5, 0.1)
           for x, y in xy]

collection = PatchCollection(patches,
                             array = z,
                             edgecolors ='brown',
                             lw = 2)

fig, ax = plt.subplots()

ax.patch.set(facecolor ='green')
ax.add_collection(collection)
ax.autoscale()

plt.show()
輸出:
相關用法
- Python Matplotlib.ticker.MultipleLocator用法及代碼示例
- Python Matplotlib.gridspec.GridSpec用法及代碼示例
- Python Matplotlib.patches.CirclePolygon用法及代碼示例
- Python Matplotlib.colors.Normalize用法及代碼示例
注:本文由純淨天空篩選整理自RajuKumar19大神的英文原創作品 Matplotlib.patches.RegularPolygon class in Python。非經特殊聲明,原始代碼版權歸原作者所有,本譯文未經允許或授權,請勿轉載或複製。