Matplotlib是Python中令人驚歎的可視化庫,用於數組的二維圖。 Matplotlib是一個基於NumPy數組的多平台數據可視化庫,旨在與更廣泛的SciPy堆棧配合使用。
matplotlib.patches.ArrowStyle
這個matplotlib.patches.ArrowStyleclass是一個容器類,它定義了許多arrowstyle類,這些類用於沿提供的路徑創建箭頭路徑。這些主要與FancyArrowpatch一起使用。
用法: class matplotlib.patches.ArrowStyle
以下子類是為各種arrowstyle定義的;
| 類 | 名稱 | 屬性 |
|---|---|---|
| Curve | -- | None |
| CurveB | -> | head_length = 0.4,head_width = 0.2 |
| BracketB | -[ | 寬度B = 1.0,長度B = 0.2,角度B =無 |
| CurveFilledB | -|> | head_length = 0.4,head_width = 0.2 |
| CurveA | <- | head_length = 0.4,head_width = 0.2 |
| CurveAB | <-|> | head_length = 0.4,head_width = 0.2 |
| CurveFilledA | <|- | head_length = 0.4,head_width = 0.2 |
| CurveFilledAB | <|-|> | head_length = 0.4,head_width = 0.2 |
| BracketA | ]- | 寬度A = 1.0,長度A = 0.2,角度A =無 |
| BracketAB | ]-[ | widthA = 1.0,lengthA = 0.2,angleA = None,widthB = 1.0,lengthB = 0.2,angleB = None |
| Fancy | fancy | head_length = 0.4,head_width = 0.4,tail_width = 0.4 |
| Simple | simple | head_length = 0.5,head_width = 0.5,tail_width = 0.2 |
| Wedge | wedge | tail_width = 0.3,shrink_factor = 0.5 |
| BarAB | |-| | widthA = 1.0,angleA = None,widthB = 1.0,angleB = None |
範例1:
import matplotlib.pyplot as plt
from matplotlib.patches import ArrowStyle

plt.figure(1, figsize =(9, 9))

ArrowStyle("Wedge")

ax = plt.subplot(111)

ax.annotate("",
            xy =(0.2, 0.2), xycoords ='data',
            xytext =(0.8, 0.8), textcoords ='data',
            arrowprops = dict(arrowstyle ="Wedge",
                            connectionstyle ="arc3"),
            )

plt.show()
輸出: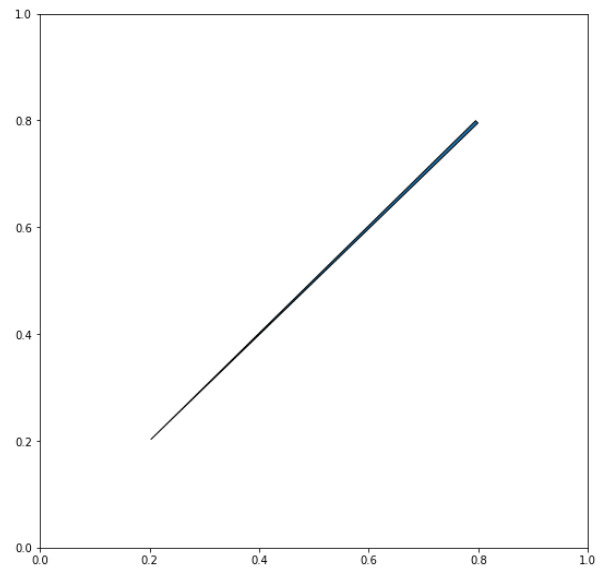
範例2:
import matplotlib.patches as mpatch
import matplotlib.pyplot as plt


figheight = 8
fig = plt.figure(figsize =(9, figheight), dpi = 80)
fontsize = 0.4 * fig.dpi

def make_boxstyles(ax):
    styles = mpatch.BoxStyle.get_styles()

    for i, (stylename, styleclass) in enumerate(sorted(styles.items())):
        ax.text(0.5,
                (float(len(styles)) - 0.5 - i)/len(styles),
                stylename,
                ha ="center",
                size = fontsize,
                transform = ax.transAxes,
                bbox = dict(boxstyle = stylename,
                            fc ="g", ec ="r"))

def make_arrowstyles(ax):
    styles = mpatch.ArrowStyle.get_styles()

    ax.set_xlim(0, 4)
    ax.set_ylim(0, figheight)

    for i, (stylename, styleclass) in enumerate(sorted(styles.items())):

        # /figheight
        y = (float(len(styles)) - 0.25 - i
        p = mpatch.Circle((3.2, y), 0.2, fc ="r")
        ax.add_patch(p)

        ax.annotate(stylename, (3.2, y),
                    (2., y),

                    # xycoords ="figure fraction",
                    # textcoords ="figure fraction",
                    ha ="right", va ="center",
                    size = fontsize,
                    arrowprops = dict(arrowstyle = stylename,
                                    patchB = p,
                                    shrinkA = 5,
                                    shrinkB = 5,
                                    fc ="w", ec ="r",
                                    connectionstyle ="arc3, rad =-0.05",
                                    ),
                    bbox = dict(boxstyle ="square", fc ="g"))

    ax.xaxis.set_visible(False)
    ax.yaxis.set_visible(False)


ax1 = fig.add_subplot(121, frameon = False, xticks =[], yticks =[])
make_boxstyles(ax1)

ax2 = fig.add_subplot(122, frameon = False, xticks =[], yticks =[])
make_arrowstyles(ax2)


plt.show()
輸出: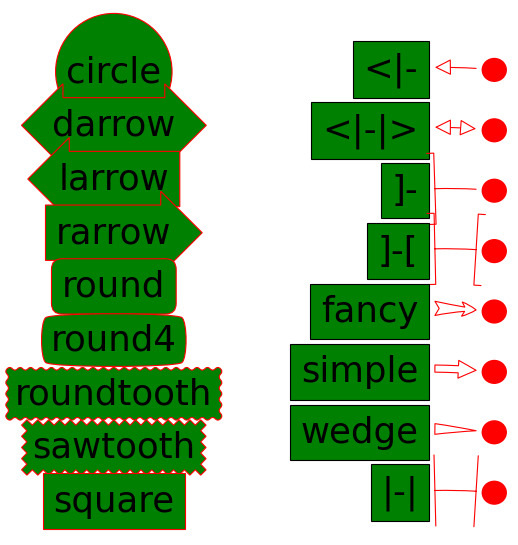
相關用法
- Python Matplotlib.ticker.MultipleLocator用法及代碼示例
- Python Matplotlib.gridspec.GridSpec用法及代碼示例
- Python Matplotlib.patches.CirclePolygon用法及代碼示例
- Python Matplotlib.colors.Normalize用法及代碼示例
注:本文由純淨天空篩選整理自RajuKumar19大神的英文原創作品 Matplotlib.patches.ArrowStyle class in Python。非經特殊聲明,原始代碼版權歸原作者所有,本譯文未經允許或授權,請勿轉載或複製。