Matplotlib是Python中令人驚歎的可視化庫,用於數組的二維圖。 Matplotlib是一個基於NumPy數組的多平台數據可視化庫,旨在與更廣泛的SciPy堆棧配合使用。
Matplotlib.patches.Arrow
這個matplotlib.patches.Arrow類用於修補圖中的箭頭。它從繪製箭頭(x, y)至(x + dx, y + dy)並使用width參數縮放其寬度。
用法: class matplotlib.patches.Arrow(x, y, dx, dy, width=1.0, **kwargs)
參數:
- x:它代表箭頭尾部的x坐標。
- y:它表示箭頭尾部的y坐標。
- dx:它表示x方向上的箭頭長度。
- dy:它表示y方向上的箭頭長度。
- width:它是一個可選參數,默認值為1。它是箭頭寬度的比例因子。在默認值中,尾部寬度為0.2,頭部寬度為0.6。
- **kwargs:這些是下表中提到的補丁程序屬性。
| 屬性 | 描述 |
|---|---|
| agg_filter | 一個過濾器函數,它接受一個(m,n,3)浮點數組,一個dpi值返回一個(m,n,3)數組 |
| alpha | 浮點數或無 |
| animated | bool |
| 抗鋸齒或抗鋸齒 | unknown |
| capstyle | {‘butt’,“回合”,‘projecting’} |
| clip_box | Bbox |
| clip_on | bool |
| clip_path | [(Path,Transform)|補丁|無] |
| color | rgba元組的顏色或順序 |
| contains | callable |
| edgecolor或ec或edgecolors | 顏色或無或‘auto’ |
| facecolor或fc或facecolors | 顏色或無 |
| figure | figure |
| fill | bool |
| gid | str |
| hatch | {‘/’、‘\’、‘|’、‘-’、‘+’、‘x’, ‘o’、‘O’、‘.’、‘*’} |
| in_layout | bool |
| joinstyle | {‘miter’,“回合”,‘bevel’} |
| 線型或ls | {“-”,“-”,“-。”,“:”,“,(偏移量,on-off-seq),...} |
| 線寬或線寬或lw | 浮點數或無 |
| path_effects | AbstractPathEffect |
| picker | 無或布爾或浮點數或可贖回 |
| path_effects | AbstractPathEffect |
| picker | float或callable [[Artist,Event],Tuple [bool,dict]] |
| rasterized | 布爾還是無 |
| sketch_params | (比例:浮點數,長度:浮點數,隨機性:浮點數) |
| snap | 布爾還是無 |
| transform | matplotlib.transforms.Transform |
| url | str | visible | bool |
| zorder | float |
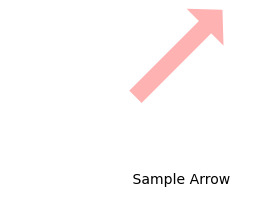
範例1:
import matplotlib.pyplot as plt
import numpy as np
import matplotlib.path as mpath
import matplotlib.lines as mlines
import matplotlib.patches as mpatches
from matplotlib.collections import PatchCollection


def label(xy, text):

    # shift y-value for label so that
    # it's below the artist
    y = xy[1] - 0.15
    plt.text(xy[0], y, text, ha ="center",
             family ='sans-serif', size = 14)


fig, ax = plt.subplots()

# create 3x3 grid to plot
# the artists
grid = np.mgrid[0.2:0.8:3j,
                0.2:0.8:3j].reshape(2, -1).T

patches = []


# add an arrow
arrow = mpatches.Arrow(grid[5, 0] - 0.05,
                       grid[5, 1] - 0.05, 0.1, 0.1,
                       width = 0.1)
patches.append(arrow)
label(grid[5], " Sample Arrow")


colors = np.linspace(0, 1, len(patches))
collection = PatchCollection(patches,
                             cmap = plt.cm.hsv,
                             alpha = 0.3)

collection.set_array(np.array(colors))
ax.add_collection(collection)

plt.axis('equal')
plt.axis('off')
plt.tight_layout()

plt.show()
輸出:
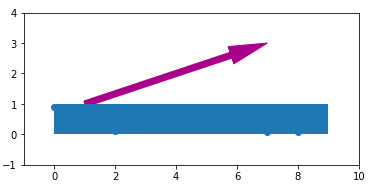
範例2:
from matplotlib import pyplot as plt
from matplotlib.patches import Rectangle, Arrow
import numpy as np


nmax = 9
xdata = range(nmax)
ydata = np.random.random(nmax)

plt.ion()
fig, ax = plt.subplots()
ax.set_aspect("equal")
ax.plot(xdata, ydata, 'o-')
ax.set_xlim(-1, 10)
ax.set_ylim(-1, 4)


rect = Rectangle((0, 0), nmax, 1, zorder = 10)
ax.add_patch(rect)

x0, y0 = 5, 3
arrow = Arrow(1, 1, x0-1, y0-1, color ="# aa0088")

a = ax.add_patch(arrow)

plt.draw()

for i in range(nmax):

    rect.set_x(i)
    rect.set_width(nmax - i)

    a.remove()
    arrow = Arrow(1 + i, 1, x0-i + 1, y0-1,
                  color ="# aa0088")
    a = ax.add_patch(arrow)

    fig.canvas.draw_idle()
    plt.pause(0.4)

plt.waitforbuttonpress()

plt.show()
輸出:
相關用法
- Python Matplotlib.ticker.MultipleLocator用法及代碼示例
- Python Matplotlib.gridspec.GridSpec用法及代碼示例
- Python Matplotlib.patches.CirclePolygon用法及代碼示例
- Python Matplotlib.colors.Normalize用法及代碼示例
注:本文由純淨天空篩選整理自RajuKumar19大神的英文原創作品 Matplotlib.patches.Arrow Class in Python。非經特殊聲明,原始代碼版權歸原作者所有,本譯文未經允許或授權,請勿轉載或複製。