matplotlib.lines.VertexSelector類屬於matplotlib.lines模塊。 matplotlib.lines模塊包含所有2D線類,可以使用各種線型,標記和顏色來繪製。 matplotlib.lines.VertexSelector類用於管理回調,該回調維護matplotlib.lines.Line2D的選定頂點的列表。這process_selected()函數被派生類的派生類覆蓋。
用法: class matplotlib.lines.VertexSelector(line)
參數:
- lines:這些代表為繪圖定義的線。
Methods of the class:
- onpick(事件):使用此方法拾取線時,所選索引集將更新。
- process_selected(self,ind,xs,ys):默認情況下,它執行process_selected()方法的“do nothing”。 ‘ind’代表選定頂點的索引,而‘xs’和‘ys’是選定頂點的坐標。
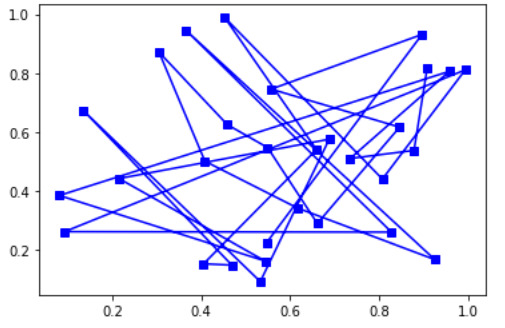
範例1:
import numpy as np
import matplotlib.pyplot as plt
import matplotlib.lines as lines


# class for highlighting selected area
class Highlighter(lines.VertexSelector):

    # constructor for the highlighter class
    def __init__(self, line, fmt ='ro', **kwargs):
        lines.VertexSelector.__init__(self, line)
        self.markers, = self.axes.plot([], [], fmt, **kwargs)

    # helper function process selected area and plot graph accordingly
    def process_selected(self, ind, xs, ys):
        self.markers.set_data(xs, ys)
        self.canvas.draw()

figure, ax = plt.subplots()
x_axis, y_axis = np.random.rand(2, 30)
line, = ax.plot(x_axis, y_axis, 'bs-', picker = 5)

selector = Highlighter(line)
plt.show()
輸出:
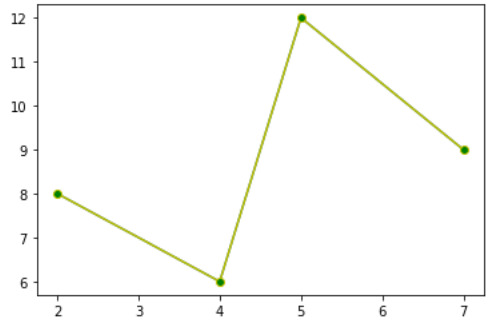
範例2:
import matplotlib.pyplot as plt
import matplotlib.lines as lines
from matplotlib.collections import PathCollection

lines.VertexSelector

# class for plot clicked area
class dragged_lines:

     # constructor for the dragged_lines class
    def __init__(self, ax):
        self.ax = ax
        self.c = ax.get_figure().canvas

        self.line = lines.Line2D(x, y, picker = 5, marker ='o',
                              markerfacecolor ='g', color ='y')

        self.ax.add_line(self.line)
        self.c.draw_idle()
        self.sid = self.c.mpl_connect('pick_event', self.lineclicker)

    def lineclicker(self, event):
        if event.artist:
            print("line selected ", event.artist)
            self.follower = self.c.mpl_connect("motion_notify_event",
                                                 self.mouse_follower)
            self.releaser = self.c.mpl_connect("button_press_event",
                                            self.release_after_click)

    def mouse_follower(self, event):
        self.line.set_data([event.xdata, event.ydata])
        self.c.draw_idle()

    def release_after_click(self, event):
        data = self.line.get_data()
        print(data)

        self.c.mpl_disconnect(self.releaser)
        self.c.mpl_disconnect(self.follower)

figure = plt.figure()
axes = figure.add_subplot(111)
x_axis, y_axis = [2, 4, 5, 7], [8, 6, 12, 9]
axes.plot(x_axis, y_axis)
Vline = dragged_lines(axes)
plt.show()
輸出:
相關用法
- Python Matplotlib.ticker.MultipleLocator用法及代碼示例
- Python Matplotlib.gridspec.GridSpec用法及代碼示例
- Python Matplotlib.patches.CirclePolygon用法及代碼示例
- Python Matplotlib.colors.Normalize用法及代碼示例
注:本文由純淨天空篩選整理自RajuKumar19大神的英文原創作品 matplotlib.lines.VertexSelector class in Python。非經特殊聲明,原始代碼版權歸原作者所有,本譯文未經允許或授權,請勿轉載或複製。