Matplotlib是Python中令人驚歎的可視化庫,用於數組的二維圖。 Matplotlib是一個基於NumPy數組的多平台數據可視化庫,旨在與更廣泛的SciPy堆棧配合使用。
Matplotlib.dates.DateFormatter
這個matplotlib.dates.DateFormatterclass用於使用strftime格式的字符串格式化刻度(自紀元以來的秒數)。它的基類是matplotlib.ticker.Formatter。
用法: class matplotlib.dates.DateFormatter(fmt, tz=None)
參數:
- fmt:它接受strftime格式字符串進行格式化,並且是必需的參數。
- tz:它保存有關時區的信息。如果設置為none,則在格式化日期字符串時將忽略時區信息。
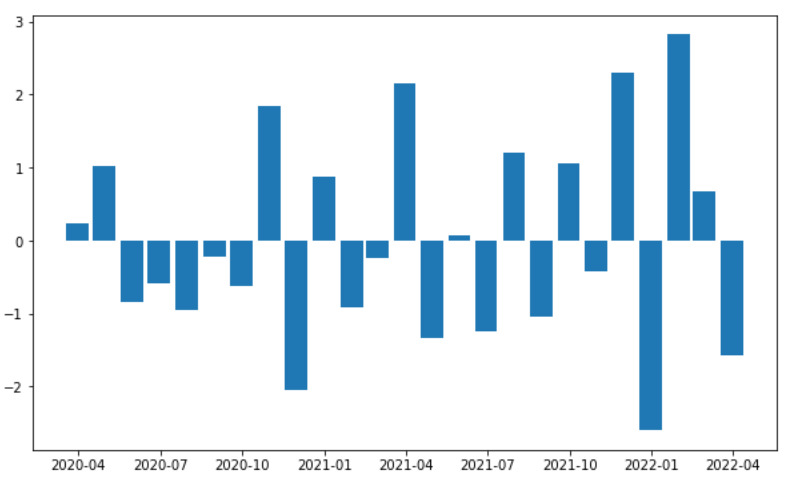
範例1:
import numpy
import matplotlib.pyplot as plt
import matplotlib.dates as mdates
import pandas


total_bars = 25
numpy.random.seed(total_bars)

dates = pandas.date_range('3/4/2020',
                          periods=total_bars,
                          freq='m')

diff = pandas.DataFrame(
    data=numpy.random.randn(total_bars),
    index=dates,
    columns=['A']
)

figure, axes = plt.subplots(figsize=(10, 6))

axes.xaxis.set_major_formatter(mdates.DateFormatter('%Y-%m'))

axes.bar(diff.index,
         diff['A'],
         width=25,
         align='center')
輸出:
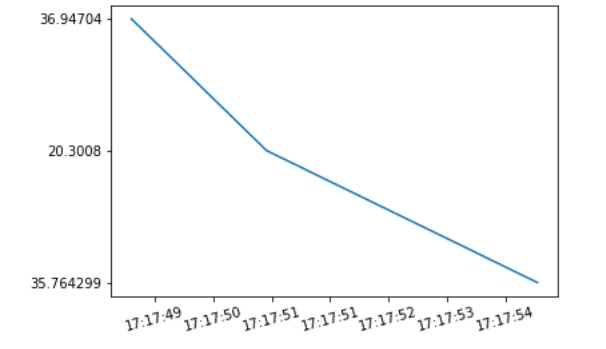
範例2:
import matplotlib
import matplotlib.pyplot as plt
from datetime import datetime

origin = ['2020-02-05 17:17:55',
          '2020-02-05 17:17:51',
          '2020-02-05 17:17:49']

a = [datetime.strptime(d, '%Y-%m-%d %H:%M:%S') for d in origin]

b = ['35.764299', '20.3008', '36.94704']

x = matplotlib.dates.date2num(a)
formatter = matplotlib.dates.DateFormatter('%H:%M:%S')

figure = plt.figure()
axes = figure.add_subplot(1, 1, 1)

axes.xaxis.set_major_formatter(formatter)
plt.setp(axes.get_xticklabels(), rotation = 15)

axes.plot(x, b)
plt.show()
輸出:
相關用法
- Python Matplotlib.ticker.MultipleLocator用法及代碼示例
- Python Matplotlib.gridspec.GridSpec用法及代碼示例
- Python Matplotlib.patches.CirclePolygon用法及代碼示例
- Python Matplotlib.colors.Normalize用法及代碼示例
注:本文由純淨天空篩選整理自RajuKumar19大神的英文原創作品 Matplotlib.dates.DateFormatter class in Python。非經特殊聲明,原始代碼版權歸原作者所有,本譯文未經允許或授權,請勿轉載或複製。