Matplotlib是Python中令人驚歎的可視化庫,用於數組的二維圖。 Matplotlib是一個基於NumPy數組的多平台數據可視化庫,旨在與更廣泛的SciPy堆棧配合使用。
注意:有關更多信息,請參閱Python Matplotlib-概述
matplotlib.colors.SysLogNorm
matplotlib.colors.SysLogNorm類屬於matplotlib.colors模塊。 matplotlib.colors模塊用於將顏色或數字參數轉換為RGBA或RGB。此模塊用於將數字映射到顏色或以一維顏色數組(也稱為colormap)進行顏色規格轉換。
matplotlib.colors.SymLogNorm類用於從原點到正向和負向的對稱對數縮放。由於接近零範圍的值趨於無窮大,因此需要在零附近具有線性範圍。繪圖呈線性的範圍稱為linthresh。線性範圍(-linthresh到+ linthresh)在linscale的幫助下相對於對數範圍超出了範圍。線性範圍的每一半要使用的十年數是其值。例如,如果linscale == 1.0(這也是默認值),則線性範圍的正半部和負半部所覆蓋的空間等於自然對數範圍內的十進製。
該類的方法:
- autoscale(self, A):用於設置A的Vmax和Vmin。
- autoscale_None(self, A):它用於自動縮放以None為值的vmax vmin。
- inverse(self, value):它返回值的對數倒數。
範例1:
import numpy as np
import matplotlib.pyplot as plt
import matplotlib.colors as colors
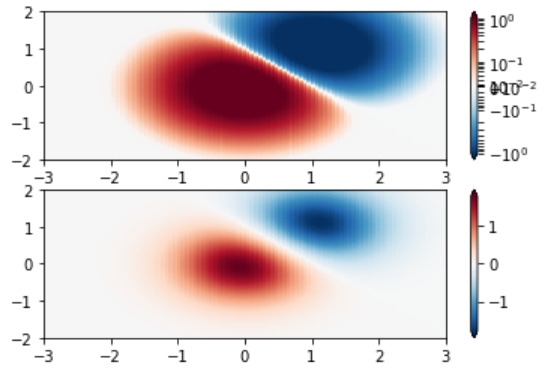
# SymLogNorm:two humps, one
# negative and one positive
N = 100
A, B = np.mgrid[-3:3:complex(0, N), -2:2:complex(0, N)]
C1 = np.exp(-A**2 - B**2)
C2 = np.exp(-(A - 1)**2 - (B - 1)**2)
C = (C1 - C2) * 2
figure, axes = plt.subplots(2, 1)
pcm = axes[0].pcolormesh(A, B, C,
norm = colors.SymLogNorm(linthresh = 0.03,
linscale = 0.03,
vmin =-1.0,
vmax = 1.0),
cmap ='RdBu_r')
figure.colorbar(pcm, ax = axes[0], extend ='both')
pcm = axes[1].pcolormesh(A, B, C,
cmap ='RdBu_r',
vmin =-np.max(C))
figure.colorbar(pcm, ax = axes[1],
extend ='both')
plt.show()輸出:
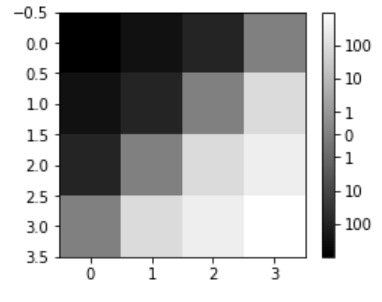
範例2:
import numpy as np
import matplotlib.pyplot as plt
from matplotlib import colors, ticker

# helper function to
# show syslognorm in action
def symlog(arr, vmin = None, vmax = None,
           logthresh = 5, logstep = 1,
           linscale = 1, **kwargs):

    vmin = arr.min() if vmin is None else vmin
    vmax = arr.max() if vmax is None else vmax
    image = plt.imshow(arr,
                       vmin = float(vmin),
                       vmax = float(vmax),
                       norm = colors.SymLogNorm(10**-logthresh,
                                                linscale = linscale),
                       **kwargs)

    maxlog = int(np.ceil(np.log10(vmax)))
    minlog = int(np.ceil(np.log10(-vmin)))

    # generate logarithmic ticks
    tick_locations =([-(10**x) for x in range(-logthresh,
                                             minlog + 1,
                                             logstep)][::-1]
                    +[0.0]
                    +[(10**x) for x in range(-logthresh,
                                             maxlog + 1,
                                             logstep)] )

    cb = plt.colorbar(ticks = tick_locations,
                    format = ticker.LogFormatter())

    return image, cb

data = np.arange(4).reshape(-1, 1)+np.arange(4).reshape(1, -1)
data = 10**(data / 2.)
data2 = data - data[::-1,::-1]
plt.figure(figsize =(4, 3))
image, cb = symlog(data2, interpolation ="None",
                   cmap ="gray", logthresh = 0)
plt.show()
輸出:
相關用法
- Python Matplotlib.ticker.MultipleLocator用法及代碼示例
- Python Matplotlib.gridspec.GridSpec用法及代碼示例
- Python Matplotlib.patches.CirclePolygon用法及代碼示例
- Python Matplotlib.colors.Normalize用法及代碼示例
注:本文由純淨天空篩選整理自RajuKumar19大神的英文原創作品 Matplotlib.colors.SymLogNorm class in Python。非經特殊聲明,原始代碼版權歸原作者所有,本譯文未經允許或授權,請勿轉載或複製。