- 关于随机:对于随机,我们采用.rand()
numpy.random.rand(d0,d1,...,dn):
创建指定形状的数组,然后
用随机值填充它。
参数:d0, d1, ..., dn : [int, optional] Dimension of the returned array we require, If no argument is given a single Python float is returned.
返回:
Array of defined shape, filled with random values.
-
关于正常:对于随机,我们采用.normal()
numpy.random.normal(loc = 0.0,scale = 1.0,size = None):创建一个指定形状的数组,并用随机值填充它,这实际上是Normal(Gaussian)Distribution的一部分。由于其特征形状,此分布也称为钟形曲线。
参数:
loc   : [float or array_like]Mean of
the distribution.
scale : [float or array_like]Standard
Derivation of the distribution.
size  : [int or int tuples].
Output shape given as (m, n, k) then
m*n*k samples are drawn. If size is
None(by default), then a single value
is returned.
返回:
Array of defined shape, filled with
random values following normal
distribution.
代码1:随机构造一维数组
# Python Program illustrating
# numpy.random.rand() method

import numpy as geek

# 1D Array
array = geek.random.rand(5)
print("1D Array filled with random values : \n", array)
输出:
1D Array filled with random values :
 [ 0.84503968  0.61570994  0.7619945   0.34994803  0.40113761]
代码2:根据高斯分布随机构造一维数组
# Python Program illustrating
# numpy.random.normal() method

import numpy as geek

# 1D Array
array = geek.random.normal(0.0, 1.0, 5)
print("1D Array filled with random values "
      "as per gaussian distribution : \n", array)
# 3D array
array = geek.random.normal(0.0, 1.0, (2, 1, 2))
print("\n\n3D Array filled with random values "
      "as per gaussian distribution : \n", array)
输出:
1D Array filled with random values as per gaussian distribution :
 [-0.99013172 -1.52521808  0.37955684  0.57859283  1.34336863]

3D Array filled with random values as per gaussian distribution :
 [[[-0.0320374   2.14977849]]

 [[ 0.3789585   0.17692125]]]
Code3:Python程序,说明NumPy中随机与正常的图形表示
# Python Program illustrating
# graphical representation of
# numpy.random.normal() method
# numpy.random.rand() method
import numpy as geek
import matplotlib.pyplot as plot
# 1D Array as per Gaussian Distribution
mean = 0
std = 0.1
array = geek.random.normal(0, 0.1, 1000)
print("1D Array filled with random values "
"as per gaussian distribution : \n", array);
# Source Code :
# https://docs.scipy.org/doc/numpy-1.13.0/reference/
# generated/numpy-random-normal-1.py
count, bins, ignored = plot.hist(array, 30, normed=True)
plot.plot(bins, 1/(std * geek.sqrt(2 * geek.pi)) *
geek.exp( - (bins - mean)**2 / (2 * std**2) ),
linewidth=2, color='r')
plot.show()
# 1D Array constructed Randomly
random_array = geek.random.rand(5)
print("1D Array filled with random values : \n", random_array)
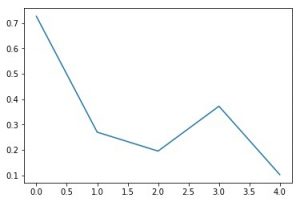
plot.plot(random_array)
plot.show()输出:
1D Array filled with random values as per gaussian distribution : [ 0.12413355 0.01868444 0.08841698 ..., -0.01523021 -0.14621625 -0.09157214]1D Array filled with random values : [ 0.72654409 0.26955422 0.19500427 0.37178803 0.10196284]
重要:
在代码3中,图1清楚地显示了高斯分布,它是根据通过random.normal()方法生成的值创建的,因此遵循高斯分布。
图2不遵循任何分布,因为它是根据random.rand()方法生成的随机值创建的。
相关用法
注:本文由纯净天空筛选整理自 rand vs normal in Numpy.random in Python。非经特殊声明,原始代码版权归原作者所有,本译文未经允许或授权,请勿转载或复制。