用法:
RandomState.standard_gamma(shape, size=None)从标准Gamma分布中抽取样本。
从具有指定参数,形状(有时指定为“k”)和比例= 1的Gamma分布中抽取样本。
参数: - shape: : float 或 array_like of floats
参数,必须为非负数。
- size: : int 或 tuple of ints, 可选参数
输出形状。如果给定的形状是
(m, n, k), 然后m * n * k抽取样品。如果尺寸是None(默认),如果返回一个值shape是标量。除此以外,np.array(shape).size抽取样品。
返回值: - out: : ndarray或标量
从参数化的标准伽玛分布中抽取样本。
注意:
Gamma分布的概率密度为

哪里
 是形状和
是形状和 规模,以及
规模,以及 是Gamma函数。
Gamma分布通常用于对电子组件的失效时间进行建模,并且在与泊松分布事件之间的等待时间相关的过程中自然产生。
参考文献:
[1] 魏斯汀(Eric W.),“伽玛分布”来自MathWorld-A Wolfram Web资源。http://mathworld.wolfram.com/GammaDistribution.html [2] 维基百科,“Gamma distribution”,https://en.wikipedia.org/wiki/Gamma_distribution 例子:
从分布中抽取样本:
>>> shape, scale = 2., 1. # mean and width
>>> s = np.random.standard_gamma(shape, 1000000)
显示样本的直方图以及概率密度函数:
>>> import matplotlib.pyplot as plt
>>> import scipy.special as sps  # doctest:+SKIP
>>> count, bins, ignored = plt.hist(s, 50, density=True)
>>> y = bins**(shape-1) * ((np.exp(-bins/scale))/  # doctest:+SKIP
...                       (sps.gamma(shape) * scale**shape))
>>> plt.plot(bins, y, linewidth=2, color='r')  # doctest:+SKIP
>>> plt.show()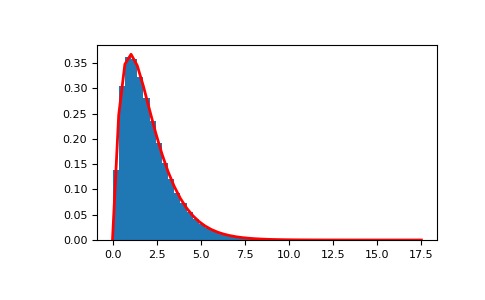
相关用法
注:本文由纯净天空筛选整理自 numpy.random.mtrand.RandomState.standard_gamma。非经特殊声明,原始代码版权归原作者所有,本译文未经允许或授权,请勿转载或复制。