用法:
RandomState.logistic(loc=0.0, scale=1.0, size=None)从物流分布中抽取样本。
从具有指定参数,位置(位置或均值,也为中位数)和比例(> 0)的对数分布中抽取样本。
参数: - loc: : float 或 array_like of floats, 可选参数
分布参数。默认值为0。
- scale: : float 或 array_like of floats, 可选参数
分布参数。必须为非负数。默认值为1。
- size: : int 或 tuple of ints, 可选参数
输出形状。如果给定的形状是
(m, n, k), 然后m * n * k抽取样品。如果尺寸是None(默认),如果返回一个值loc和scale都是标量。除此以外,np.broadcast(loc, scale).size抽取样品。
返回值: - out: : ndarray或标量
从参数化逻辑分布中抽取样本。
注意:
Logistic分布的概率密度为

哪里
 =位置和
=位置和 =比例。
=比例。Logistic分布用于极值问题,在流行病学中可以混合使用Gumbel分布,在世界象棋联合会(FIDE)中也用于Elo排名系统,假设每个玩家的表现都是逻辑分布的随机变量。
参考文献:
[1] Reiss,R.-D.和Thomas M.(2001),“来自保险,金融,水文学和其他领域的极值统计分析”,Birkhauser Verlag,巴塞尔,第132-133页。 [2] Weisstein,EricW。“物流配送”。来自MathWorld-A Wolfram Web资源。http://mathworld.wolfram.com/LogisticDistribution.html [3] 维基百科,“Logistic-distribution”,https://en.wikipedia.org/wiki/Logistic_distribution 例子:
从分布中抽取样本:
>>> loc, scale = 10, 1
>>> s = np.random.logistic(loc, scale, 10000)
>>> import matplotlib.pyplot as plt
>>> count, bins, ignored = plt.hist(s, bins=50)
#针对分布图
>>> def logist(x, loc, scale):
...     return np.exp((loc-x)/scale)/(scale*(1+np.exp((loc-x)/scale))**2)
>>> lgst_val = logist(bins, loc, scale)
>>> plt.plot(bins, lgst_val * count.max() / lgst_val.max())
>>> plt.show()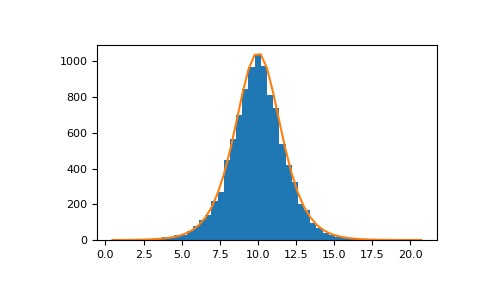
相关用法
注:本文由纯净天空筛选整理自 numpy.random.mtrand.RandomState.logistic。非经特殊声明,原始代码版权归原作者所有,本译文未经允许或授权,请勿转载或复制。