Matplotlib 是 Python 中的一个库,它是 NumPy 库的数学扩展。 Pyplot 是 Matplotlib 模块的基于状态的接口,它提供 MATLAB-like 接口。
matplotlib.pyplot.suptitle() 函数
matplotlib 库的 pyplot 模块中的 suptitle() 函数用于为图形添加标题。
用法:matplotlib.pyplot.suptitle(t, **kwargs)
参数:该函数将具有以下参数:
- t:要添加到图表的标题文本。
- x:图坐标中文本的 x 位置。它的默认值为 0.5。
- y:图坐标中文本的 y 位置。默认值为 0.98。
- horizontalalignment (ha) :{‘center’, ‘left’, right'},文本的水平对齐方式是相对于(x, y)。默认值为 ‘center’。
- verticalalignment (va):{‘top’, ‘center’, ‘bottom’, ‘baseline’},文本的垂直对齐方式是相对于(x, y)。默认值为 ‘top’。
- fontsize, size:{size in points, ‘xx-small’, ‘x-small’, ‘small’, ‘medium’, ‘large’, ‘x-large’, ‘xx-large’}, 文本的字体大小。默认值为 ‘large’。
- fontweight, weight:{0-1000 范围内的数值,‘ultralight’, ‘light’,‘normal’, ‘regular’,‘book’, ‘medium’,‘roman’, ‘semibold’,‘demibold’, ‘demi’,‘bold’, ‘heavy’,'extra bold',‘black’},文本的字体粗细。默认值为 ‘normal’。
- fontproperties:无或字典,字体属性的字典。如果给定 fontproperties,则字体大小和粗细的默认值取自 FontProperties 默认值。在这种情况下,rcParams[“figure.titlesize”] = ‘large’ 和 rcParams[“figure.titleweight”] = ‘normal’ 被忽略。
- **kwargs:其他 kwargs 是 matplotlib.text.Text 属性。
返回值:标题的 Text 实例。
下面的示例说明了 matplotlib.pyplot 中的 matplotlib.pyplot.suptitle() 函数:
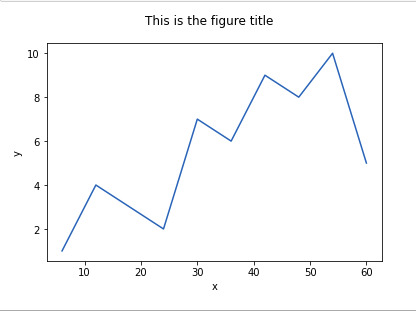
范例1:为图表添加标题,字体大小为 12。
Python3
# importing matplotlib.pyplot module
import matplotlib.pyplot as plt

# values of x and y axes
x = [6, 12, 18,
     24, 30, 36,
     42, 48, 54,
     60]
y = [1, 4, 3,
     2, 7, 6,
     9, 8, 10,
     5]

# plotting the graph
plt.plot(x, y)

# labelling axes
plt.xlabel('x')
plt.ylabel('y')

# adding title to the graph
# with font size 12
plt.suptitle('This is the figure title',
             fontsize = 12)

# show the plot
plt.show()
输出:

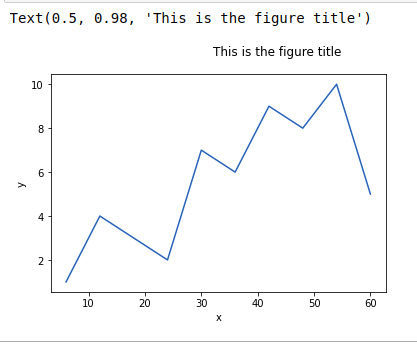
范例2:使用左水平对齐和字体大小为图形添加标题 12。
Python3
# importing matplotlib.pyplot module
import matplotlib.pyplot as plt

# values of x and y axes
x = [6, 12, 18,
     24, 30, 36,
     42, 48, 54,
     60]

y = [1, 4, 3,
     2, 7, 6,
     9, 8, 10,
     5]

# plotting the graph
plt.plot(x, y)

# labelling axes
plt.xlabel('x')
plt.ylabel('y')

# Adding title to the graph
# with left horizontal alignment
# and font size 12.
plt.suptitle('This is the figure title',
             ha = 'left',
             fontsize = 12)
输出:

范例3:使用额外的粗体字重和大字体为图表添加标题。
Python3
# importing matplotlib.pyplot module
import matplotlib.pyplot as plt

# values of x and y axes
x = [6, 12, 18,
     24, 30, 36,
     42, 48, 54,
     60]

y = [1, 4, 3,
     2, 7, 6,
     9, 8, 10,
     5]

# plotting the graph
plt.plot(x, y)

# labelling axes
plt.xlabel('x')
plt.ylabel('y')

# Adding title to the graph
# with extra bold font weight
# and large font size.
plt.suptitle('This is the figure title',
             fontsize = 'xx-large',
             weight = 'extra bold')
输出:

相关用法
- Python Wand function()用法及代码示例
- Python Numbers choice()用法及代码示例
- Python ord()用法及代码示例
- Python sum()用法及代码示例
- Python round()用法及代码示例
- Python id()用法及代码示例
- Python vars()用法及代码示例
注:本文由纯净天空筛选整理自ankthon大神的英文原创作品 Matplotlib.pyplot.suptitle() function in Python。非经特殊声明,原始代码版权归原作者所有,本译文未经允许或授权,请勿转载或复制。
