Matplotlib 是 Python 中的一個庫,它是 NumPy 庫的數學擴展。 Pyplot 是 Matplotlib 模塊的基於狀態的接口,它提供 MATLAB-like 接口。
matplotlib.pyplot.suptitle() 函數
matplotlib 庫的 pyplot 模塊中的 suptitle() 函數用於為圖形添加標題。
用法:matplotlib.pyplot.suptitle(t, **kwargs)
參數:該函數將具有以下參數:
- t:要添加到圖表的標題文本。
- x:圖坐標中文本的 x 位置。它的默認值為 0.5。
- y:圖坐標中文本的 y 位置。默認值為 0.98。
- horizontalalignment (ha) :{‘center’, ‘left’, right'},文本的水平對齊方式是相對於(x, y)。默認值為 ‘center’。
- verticalalignment (va):{‘top’, ‘center’, ‘bottom’, ‘baseline’},文本的垂直對齊方式是相對於(x, y)。默認值為 ‘top’。
- fontsize, size:{size in points, ‘xx-small’, ‘x-small’, ‘small’, ‘medium’, ‘large’, ‘x-large’, ‘xx-large’}, 文本的字體大小。默認值為 ‘large’。
- fontweight, weight:{0-1000 範圍內的數值,‘ultralight’, ‘light’,‘normal’, ‘regular’,‘book’, ‘medium’,‘roman’, ‘semibold’,‘demibold’, ‘demi’,‘bold’, ‘heavy’,'extra bold',‘black’},文本的字體粗細。默認值為 ‘normal’。
- fontproperties:無或字典,字體屬性的字典。如果給定 fontproperties,則字體大小和粗細的默認值取自 FontProperties 默認值。在這種情況下,rcParams[“figure.titlesize”] = ‘large’ 和 rcParams[“figure.titleweight”] = ‘normal’ 被忽略。
- **kwargs:其他 kwargs 是 matplotlib.text.Text 屬性。
返回值:標題的 Text 實例。
下麵的示例說明了 matplotlib.pyplot 中的 matplotlib.pyplot.suptitle() 函數:
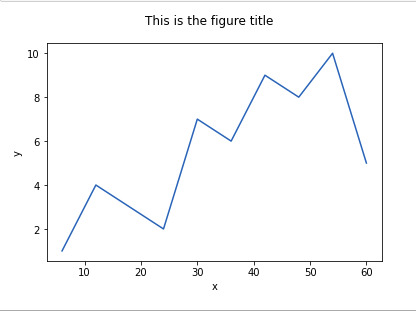
範例1:為圖表添加標題,字體大小為 12。
Python3
# importing matplotlib.pyplot module
import matplotlib.pyplot as plt

# values of x and y axes
x = [6, 12, 18,
     24, 30, 36,
     42, 48, 54,
     60]
y = [1, 4, 3,
     2, 7, 6,
     9, 8, 10,
     5]

# plotting the graph
plt.plot(x, y)

# labelling axes
plt.xlabel('x')
plt.ylabel('y')

# adding title to the graph
# with font size 12
plt.suptitle('This is the figure title',
             fontsize = 12)

# show the plot
plt.show()
輸出:
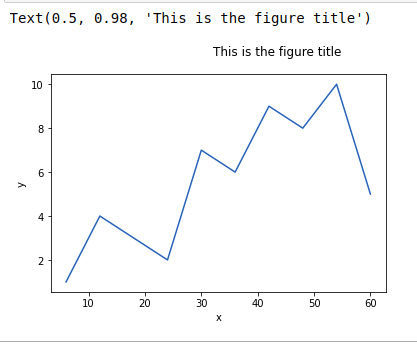
範例2:使用左水平對齊和字體大小為圖形添加標題 12。
Python3
# importing matplotlib.pyplot module
import matplotlib.pyplot as plt

# values of x and y axes
x = [6, 12, 18,
     24, 30, 36,
     42, 48, 54,
     60]

y = [1, 4, 3,
     2, 7, 6,
     9, 8, 10,
     5]

# plotting the graph
plt.plot(x, y)

# labelling axes
plt.xlabel('x')
plt.ylabel('y')

# Adding title to the graph
# with left horizontal alignment
# and font size 12.
plt.suptitle('This is the figure title',
             ha = 'left',
             fontsize = 12)
輸出:
範例3:使用額外的粗體字重和大字體為圖表添加標題。
Python3
# importing matplotlib.pyplot module
import matplotlib.pyplot as plt

# values of x and y axes
x = [6, 12, 18,
     24, 30, 36,
     42, 48, 54,
     60]

y = [1, 4, 3,
     2, 7, 6,
     9, 8, 10,
     5]

# plotting the graph
plt.plot(x, y)

# labelling axes
plt.xlabel('x')
plt.ylabel('y')

# Adding title to the graph
# with extra bold font weight
# and large font size.
plt.suptitle('This is the figure title',
             fontsize = 'xx-large',
             weight = 'extra bold')
輸出:

相關用法
- Python Wand function()用法及代碼示例
- Python Numbers choice()用法及代碼示例
- Python ord()用法及代碼示例
- Python sum()用法及代碼示例
- Python round()用法及代碼示例
- Python id()用法及代碼示例
- Python vars()用法及代碼示例
注:本文由純淨天空篩選整理自ankthon大神的英文原創作品 Matplotlib.pyplot.suptitle() function in Python。非經特殊聲明,原始代碼版權歸原作者所有,本譯文未經允許或授權,請勿轉載或複製。