Matplotlib是最流行的Python-ready软件包,用于可视化数据。我们使用matplotlib绘制high-quality图表,图形和图形。
matplotlib.pyplot.semilogy()函数
matplotlib库的pyplot模块中的matplotlib.pyplot.semilogy()函数用于绘制在y轴上具有对数刻度的图。
用法: matplotlib.pyplot.semilogy(*args, **kwargs)
参数:此方法接受下面描述的以下参数:
- basey:此参数是y对数的底,并且是可选参数,默认值为10。
- subsy:此参数是次要Y刻度的位置顺序,并且是可选的。
- nonposy:此参数是y中的一个非正值,可以将其屏蔽为无效值,或裁剪为非常小的正数。
返回值:这将返回以下内容:
- 行:这将返回代表绘制数据的Line2D对象的列表。
以下示例说明了matplotlib.pyplot中的matplotlib.pyplot.semilogy()函数:
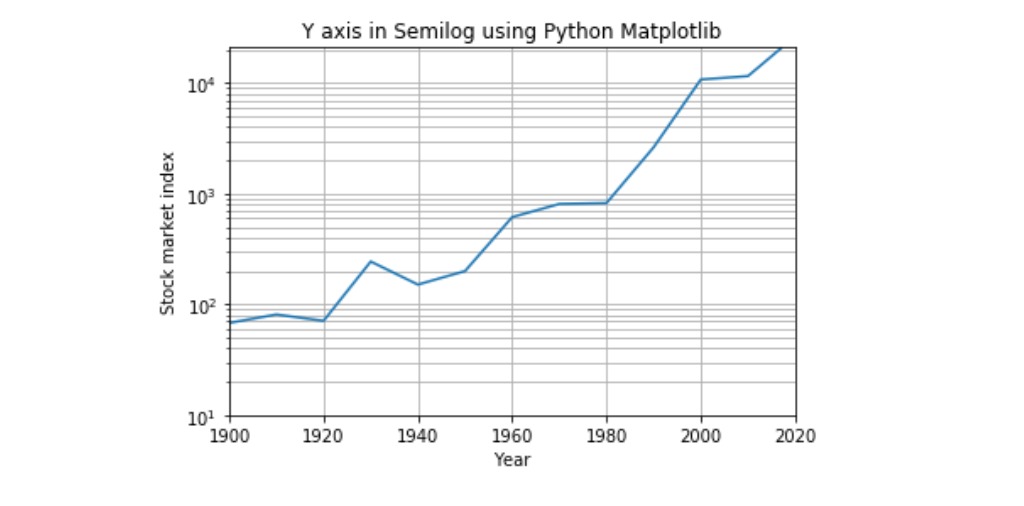
范例1:
# importing necessary libraries
import matplotlib.pyplot as plot
import numpy as np

# Year data for the semilogy plot
years = [1900, 1910, 1920, 1930, 1940, 1950,
         1960, 1970, 1980, 1990, 2000, 2010,
         2017]

# index data - taken at end of every
# decade - for the semilogy plot
indexValues = [68, 81, 71, 244, 151, 200, 615,
               809, 824, 2633, 10787, 11577,
               20656]

# Display grid
plot.grid(True, which ="both")

# Linear X axis, Logarithmic Y axis
plot.semilogy(years, indexValues )

plot.ylim([10, 21000])

plot.xlim([1900, 2020])

# Provide the title for the semilogy plot
plot.title('Y axis in Semilogy using Python Matplotlib')

# Give x axis label for the semilogy plot
plot.xlabel('Year')

# Give y axis label for the semilogy plot
plot.ylabel('Stock market index')

# Display the semilogy plot
plot.show()
输出:
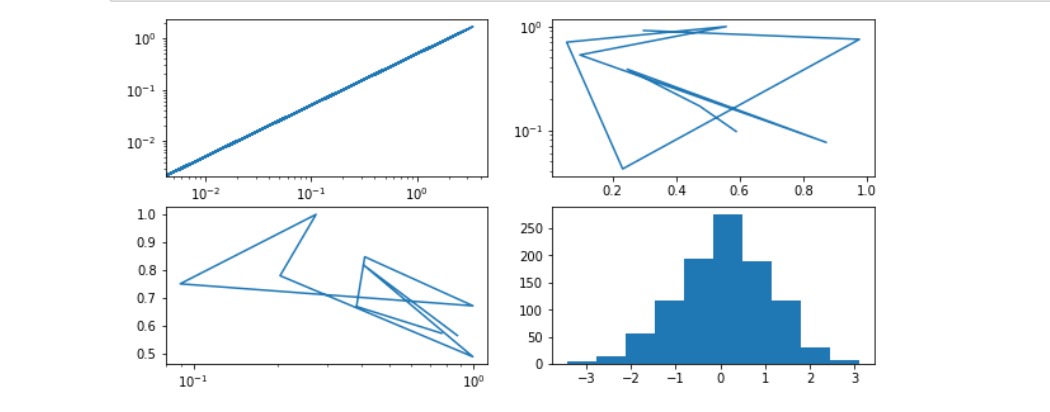
范例2:
# importing necessary libraries
import matplotlib.pyplot as plt
import numpy as np


fig, ax = plt.subplots(nrows = 2,
                      ncols = 2,
                      figsize =(10, 5))
x = np.random.randn(1000)

# Plot to each different index
ax[0, 0].loglog(x, x / 2);
ax[0, 1].semilogy(np.random.random(10), np.random.random(10));
ax[1, 0].semilogx(np.random.random(10), np.random.random(10));
ax[1, 1].hist(np.random.randn(1000));
输出:
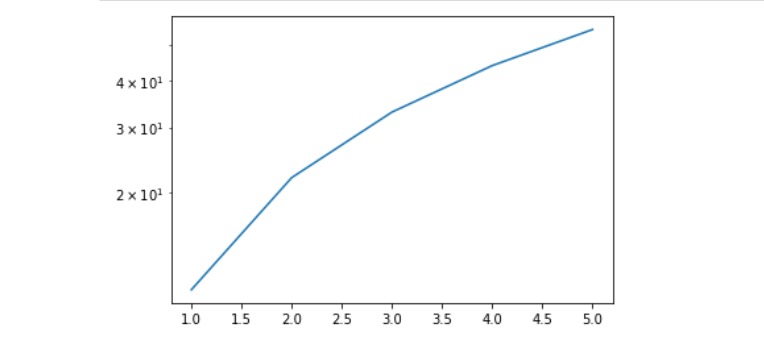
范例3:
# importing necessary libraries
import matplotlib.pyplot as plt
import numpy as np


x = [1, 2, 3, 4, 5]
y = [11, 22, 33, 44, 55]

fig, ax = plt.subplots()
ax.semilogy(x, y);
输出:
相关用法
- Python Wand function()用法及代码示例
- Python tell()用法及代码示例
- Python id()用法及代码示例
- Python map()用法及代码示例
- Python dir()用法及代码示例
- Python cmp()用法及代码示例
- Python int()用法及代码示例
- Python ord()用法及代码示例
- Python hex()用法及代码示例
- Python now()用法及代码示例
- Python oct()用法及代码示例
- Python str()用法及代码示例
- Python sum()用法及代码示例
- Python seek()用法及代码示例
- Python reversed()用法及代码示例
注:本文由纯净天空筛选整理自yogesh_pandey大神的英文原创作品 matplotlib.pyplot.semilogy() function in Python。非经特殊声明,原始代码版权归原作者所有,本译文未经允许或授权,请勿转载或复制。