Matplotlib是用于数据可视化的著名Python软件包。 Numpy是Matplotlib的数字数学扩展。 Matplotlib能够生成high-quality个图形,图表和图形。 Matplotlib生成面向对象的API,以便使用GUI工具包(例如Tkinter,wxPython或Qt)将图嵌入到项目中。 John D. Hunter是Matplotlib的原始开发人员,它以BSD-style许可证发行。
matplotlib.pyplot.pcolor()
Matplotlib包含各种有助于执行不同任务的函数,其中之一是matplotlib.pyplot.pcolor()函数。 Matplotlib库的pyplot模块中的pcolor()函数有助于创建带有非规则矩形网格的pseudo-color图。
用法:matplotlib.pyplot.pcolor(*args, alpha=None, norm=None, cmap=None, vmin=None, vmax=None, data=None, **kwargs)

Call Signature: pcolor([X, Y,] C, **kwargs)

参数:

C:Denotes a scaler 2-D array

X, Y:array_like, optional, coordinates of quadrilateral corners

cmap: str or Colormap, optional

norm:Normalize, optional

vmin, vmax:scaler, optional

edgecolors:{‘none’, None, ‘face’, color sequence}, optional

alpha:scaler, optional

snap:bool, optional

Other Parameters:

antialiaseds:bool, optional

**kwargs

返回:The function returns a collection i.e matplotlib.collections.Collection
注意:如果数组较大,则matplotlib.pyplot.pcolor()的运行速度非常慢。
下面的示例演示matplotlib.pyplot.pcolor()函数的工作方式:
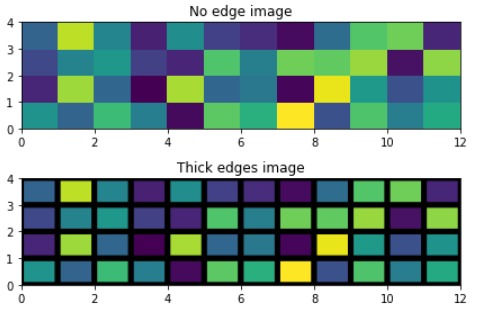
示例1:使用pcolor()函数生成图像
借助pcolor()函数,我们可以生成二维image-style图,如下所示
Python3
# Demonstration of matplotlib function
import matplotlib.pyplot as plt
import numpy as np
from matplotlib.colors import LogNorm

Z = np.random.rand(4, 12)

fig, (ax0, ax1) = plt.subplots(2, 1)

c = ax0.pcolor(Z)
ax0.set_title('No edge image')

c = ax1.pcolor(Z, edgecolors='k', linewidths=5)
ax1.set_title('Thick edges image')

fig.tight_layout()
plt.show()
输出:

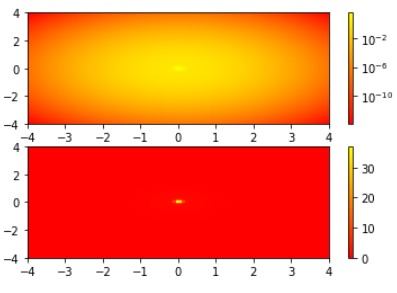
示例2:以对数刻度工作pcolor()
Python3
# Demonstration of matplotlib function
import matplotlib.pyplot as plt
import numpy as np
from matplotlib.colors import LogNorm

N = 100
X, Y = np.mgrid[-4:4:complex(0, N), -4:4:complex(0, N)]

# Image show that a low hump with a spike coming out.
# We need a z/colour axis on a log scale in order
# to watch both hump and spike.
Z1 = np.exp(-(X)**2 - (Y)**2)
Z2 = np.exp(-(X * 10)**2 - (Y * 10)**2)
Z = Z1 + 50 * Z2

fig, (ax0, ax1) = plt.subplots(2, 1)

c = ax0.pcolor(X, Y, Z,norm=LogNorm(vmin=Z.min(), vmax=Z.max()), cmap=plt.cm.autumn)

fig.colorbar(c, ax=ax0)

c = ax1.pcolor(X, Y, Z, cmap=plt.cm.autumn)
fig.colorbar(c, ax=ax1)

plt.show()
输出:

相关用法
- Python Wand function()用法及代码示例
- Python Sorted()用法及代码示例
- Python Numbers choice()用法及代码示例
- Python Tkinter askopenfile()用法及代码示例
- Python ord()用法及代码示例
- Python round()用法及代码示例
- Python id()用法及代码示例
- Python vars()用法及代码示例
注:本文由纯净天空筛选整理自vanshgaur14866大神的英文原创作品 Matplotlib.pyplot.pcolor() function in Python。非经特殊声明,原始代码版权归原作者所有,本译文未经允许或授权,请勿转载或复制。
