Matplotlib是Python中的一个库,它是数字的-NumPy库的数学扩展。 Pyplot是Matplotlib模块的基于状态的接口,该模块提供了MATLAB-like接口。
matplotlib.pyplot.hist()函数
matplotlib库的pyplot模块中的hist()函数用于绘制直方图。
用法: matplotlib.pyplot.hist(x, bins=None, range=None, density=False, weights=None, cumulative=False, bottom=None, histtype=’bar’, align=’mid’, orientation=’vertical’, rwidth=None, log=False, color=None, label=None, stacked=False, \*, data=None, \*\*kwargs)
参数:此方法接受以下描述的参数:
- x:此参数是数据序列。
- bins:此参数是可选参数,它包含整数,序列或字符串。
- range:此参数是可选参数,它是箱子的上下限。
- density:此参数是可选参数,它包含布尔值。
- weights:此参数是可选参数,并且是一个权重数组,与x的形状相同。
- bottom:此参数是每个容器底部基线的位置。
- histtype:此参数是可选参数,用于绘制直方图的类型。 {‘bar’,‘barstacked’,‘step’,‘stepfilled’}
- align:此参数是可选参数,它控制如何绘制直方图。 {‘left’,‘mid’,‘right’}
- rwidth:此参数是可选参数,它是条形图的相对宽度,是箱宽度的一部分
- log:此参数是可选参数,用于将直方图轴设置为对数刻度
- color:此参数是一个可选参数,它是一个颜色规格或一系列颜色规格,每个数据集一个。
- label:此参数是可选参数,它是一个字符串或匹配多个数据集的字符串序列。
- normed:此参数是可选参数,包含布尔值,而是使用density关键字参数。
返回值:这将返回以下内容:
- n:这将返回直方图箱的值。
- 垃圾桶:这将返回箱子的边。
- 补丁:这将返回用于创建直方图的单个补丁的列表。
以下示例说明了matplotlib.pyplot中的matplotlib.pyplot.hist()函数:
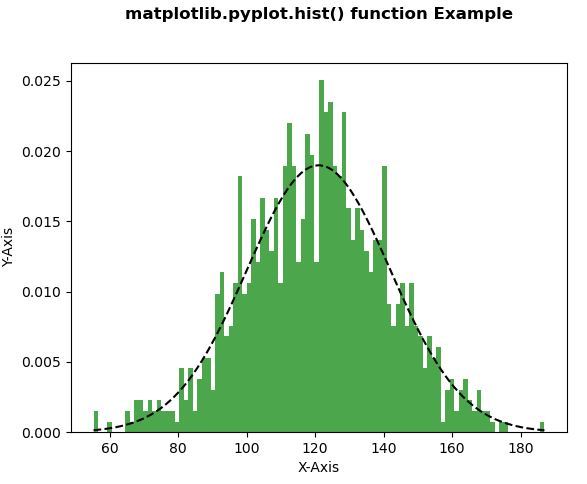
范例1:
# Implementation of matplotlib function
import matplotlib
import numpy as np
import matplotlib.pyplot as plt

np.random.seed(10**7)
mu = 121
sigma = 21
x = mu + sigma * np.random.randn(1000)

num_bins = 100

n, bins, patches = plt.hist(x, num_bins,
                            density = 1,
                            color ='green',
                            alpha = 0.7)

y = ((1 / (np.sqrt(2 * np.pi) * sigma)) *
     np.exp(-0.5 * (1 / sigma * (bins - mu))**2))

plt.plot(bins, y, '--', color ='black')

plt.xlabel('X-Axis')
plt.ylabel('Y-Axis')

plt.title('matplotlib.pyplot.hist() function Example\n\n',
          fontweight ="bold")

plt.show()
输出:
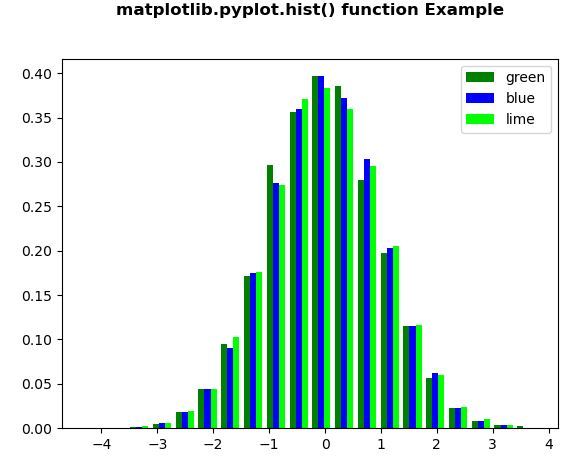
范例2:
# Implementation of matplotlib function
import matplotlib
import numpy as np
import matplotlib.pyplot as plt

np.random.seed(10**7)
n_bins = 20
x = np.random.randn(10000, 3)

colors = ['green', 'blue', 'lime']

plt.hist(x, n_bins, density = True,
         histtype ='bar',
         color = colors,
         label = colors)

plt.legend(prop ={'size':10})

plt.title('matplotlib.pyplot.hist() function Example\n\n',
          fontweight ="bold")

plt.show()
输出:
相关用法
注:本文由纯净天空筛选整理自SHUBHAMSINGH10大神的英文原创作品 Matplotlib.pyplot.hist() in Python。非经特殊声明,原始代码版权归原作者所有,本译文未经允许或授权,请勿转载或复制。