Matplotlib是用于数据可视化的最受欢迎的Python软件包之一。它是一个cross-platform库,用于根据数组中的数据制作2D图。 Pyplot是使matplotlib像MATLAB一样工作的命令样式函数的集合。
matplotlib.pyplot.broken_barh()
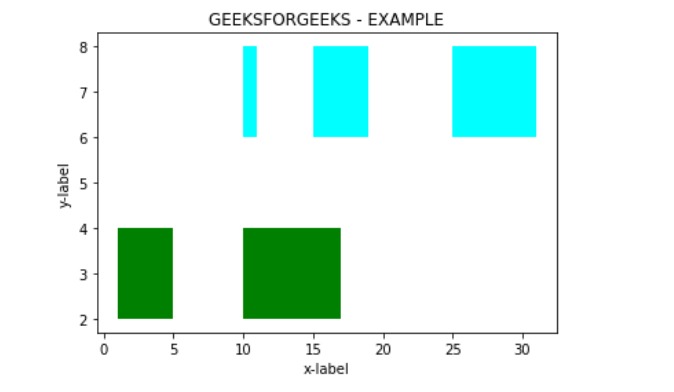
broken_barh()函数用于绘制水平矩形序列。为xrange的每个组成部分绘制一个矩形,该矩形由一系列元组组成。所有矩形都具有相同的垂直位置,并以yrange为特征进行估计。
用法: matplotlib.pyplot.broken_barh(xranges, yrange, *, data=None, **kwargs)
参数:
- xranges:元组序列(xmin,xwidth)
每个元组给出矩形的位置(xmin)以及从该位置开始的水平扩展(xwidth)。 - yranges:(ymin,ymax)
在上述属性中,ymin给出矩形的位置,ymax给出从ymin开始的垂直延伸。
返回值:
- BrokenBarHCollection:横杠的集合,横杠跨越yrange和一系列xrange。
举例说明matplotlib.pyplot.broken_barh()函数如下:
范例1:
# importing module
import matplotlib.pyplot as plt


# Adding title to the plot
plt.title('GEEKSFORGEEKS - EXAMPLE')

# adding x axis label to the plot
plt.xlabel('x-label')

# label for y axis  for the plot
plt.ylabel('y-label')

x_1 = [(1, 4), (10, 7)]
y_1 = (2, 2)

# Plotting the chart
plt.broken_barh(x_1, y_1, facecolors ='green')

x_2 = [(10, 1), (15, 4), (25, 6)]
y_2 = (6, 2)

# Plotting the chart
plt.broken_barh(x_2, y_2, facecolors ='cyan')

plt.show()
输出:

范例2:
# importing module
import matplotlib.pyplot as plt


# Adding title to the plot
plt.title('GEEKSFORGEEKS - EXAMPLE')

# adding x axis label to the plot
plt.xlabel('Number of Cars')

# label for y axis  for the plot
plt.ylabel('Average Speed')

x_1 = [(10, 3), (15, 4)]
y_1 = (50, 10)

# Plotting the chart
plt.broken_barh(x_1, y_1, facecolors ='cyan')

x_2 = [(1, 4), (10, 1), (15, 4), (25, 6)]
y_2 = (70, 10)

# Plotting the chart
plt.broken_barh(x_2, y_2, facecolors ='green')

x_3 = [(5, 3), (11, 2), (18, 5)]
y_3 = (90, 10)

# Plotting the chart
plt.broken_barh(x_3, y_3, facecolors ='blue')

plt.show()
输出:

相关用法
注:本文由纯净天空筛选整理自shardul_singh_tomar大神的英文原创作品 Matplotlib.pyplot.broken_barh() in Python。非经特殊声明,原始代码版权归原作者所有,本译文未经允许或授权,请勿转载或复制。
