Matplotlib是一个绘图库,用于在Python中创建静态,动画和交互式可视化。\ Pyplot是Matplotlib模块,提供MATLAB-like接口。 Matplotlib设计为与MATLAB一样可用,具有使用Python的能力以及免费和开源的优势。
matplotlib.pyplot.axvspan()
此函数设置跨绘图轴的垂直矩形
用法: matplotlib.pyplot.axvspan(xmin, xmax, ymin=0, ymax=1, **kwargs)
参数:
xmin:表示X轴上垂直矩形起始位置的数字
xmin:表示垂直矩形在X轴上的结束位置的数字
ymin:y轴上的垂直矩形起始位置,它将取0到1之间的值,0是该轴的底部,1是该轴的顶部
ymax:y轴上的垂直矩形结束位置,它将取0到1之间的值,0是该轴的底部,1是该轴的顶部
**kwargs:其他可选参数可更改矩形的属性,例如更改颜色等。
范例1:
# Importing matplotlib.pyplot as plt
import matplotlib.pyplot as plt
# Initializing x and y
x =[1, 15, 27, 48, 50]
y =[1, 12, 22, 45, 67]
# Plotting the graph
plt.plot(x, y)
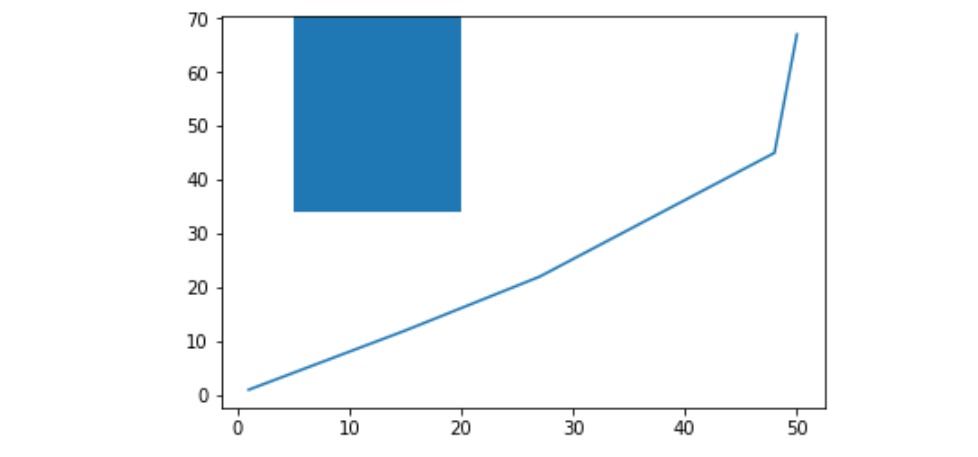
# Drawing rectangle starting
# x = 5 and extending till x = 20
# With vertical span starting at
# half the length of y-axis(ymin = 0.5)
# And extending till the top of
# axis(ymax = 1)
plt.axvspan(5, 20, ymin = 0.5, ymax = 1)
plt.show()输出:
范例2:
import matplotlib.pyplot as plt
x =[1, 15, 27, 48, 50]
y =[1, 12, 22, 45, 67]
plt.plot(x, y)
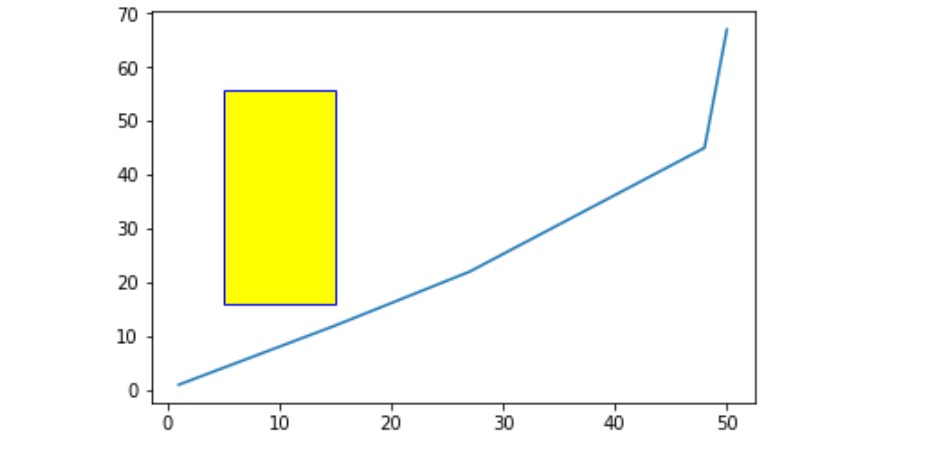
# Drawing rectangle starting
# x = 5 and extending till x = 15
# With vertical span starting at
# 25 % the length of y-axis
# And extending till the 80 % of
# axis And also we are setting
# the color of rectangle to yellow
# and its edge color to blue
plt.axvspan(5, 15, ymin = 0.25,
ymax = 0.80, ec ='blue',
color ='yellow')
plt.show()输出:
范例3:
import matplotlib.pyplot as plt
x =[1, 15, 27, 48, 50]
y =[1, 12, 22, 45, 67]
plt.plot(x, y)
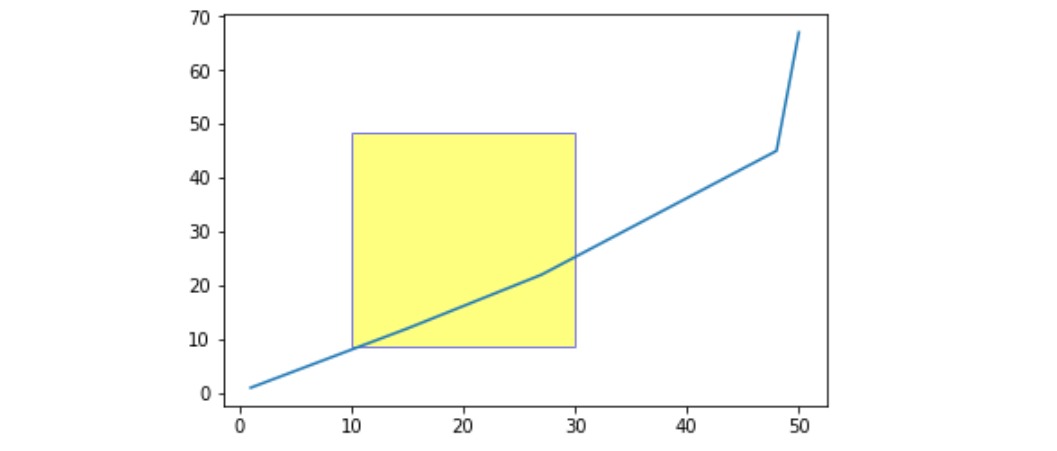
# Setting alpha will make
# the rectangle transparent
plt.axvspan(10, 30, ymin = 0.15,
ymax = 0.70, ec ='blue',
color ='yellow',
alpha = 0.5)
plt.show()输出:
相关用法
注:本文由纯净天空筛选整理自sathvik chiramana大神的英文原创作品 Matplotlib.pyplot.axvspan() in Python。非经特殊声明,原始代码版权归原作者所有,本译文未经允许或授权,请勿转载或复制。