Matplotlib是一個繪圖庫,用於在Python中創建靜態,動畫和交互式可視化。\ Pyplot是Matplotlib模塊,提供MATLAB-like接口。 Matplotlib設計為與MATLAB一樣可用,具有使用Python的能力以及免費和開源的優勢。
matplotlib.pyplot.axvspan()
此函數設置跨繪圖軸的垂直矩形
用法: matplotlib.pyplot.axvspan(xmin, xmax, ymin=0, ymax=1, **kwargs)
參數:
xmin:表示X軸上垂直矩形起始位置的數字
xmin:表示垂直矩形在X軸上的結束位置的數字
ymin:y軸上的垂直矩形起始位置,它將取0到1之間的值,0是該軸的底部,1是該軸的頂部
ymax:y軸上的垂直矩形結束位置,它將取0到1之間的值,0是該軸的底部,1是該軸的頂部
**kwargs:其他可選參數可更改矩形的屬性,例如更改顏色等。
範例1:
# Importing matplotlib.pyplot as plt
import matplotlib.pyplot as plt

# Initializing x and y
x =[1, 15, 27, 48, 50]
y =[1, 12, 22, 45, 67]

# Plotting the graph
plt.plot(x, y)

# Drawing rectangle starting
# x = 5 and extending till x = 20
# With vertical span starting at
# half the length of y-axis(ymin = 0.5)
# And extending till the top of
# axis(ymax = 1)
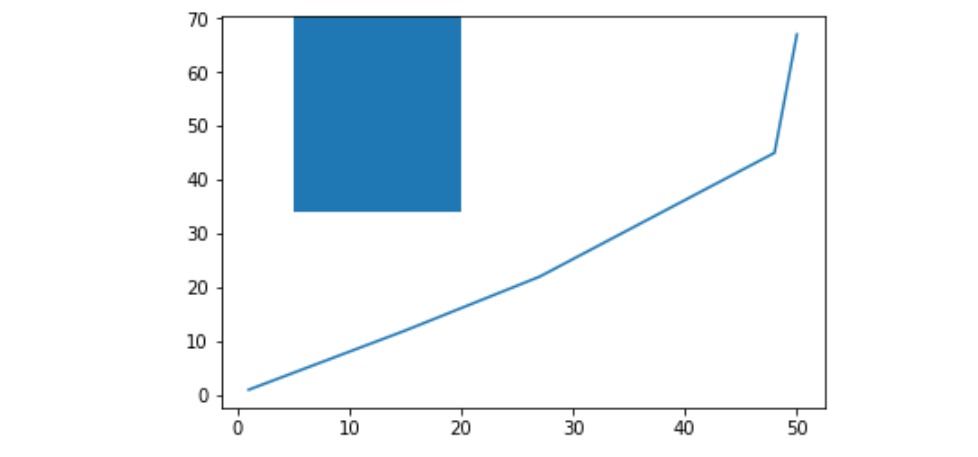
plt.axvspan(5, 20, ymin = 0.5, ymax = 1)
plt.show()
輸出:

範例2:
import matplotlib.pyplot as plt


x =[1, 15, 27, 48, 50]
y =[1, 12, 22, 45, 67]

plt.plot(x, y)

# Drawing rectangle starting
# x = 5 and extending till x = 15
# With vertical span starting at
# 25 % the length of y-axis
# And extending till the 80 % of
# axis And also we are setting
# the color of rectangle to yellow
# and its edge color to blue
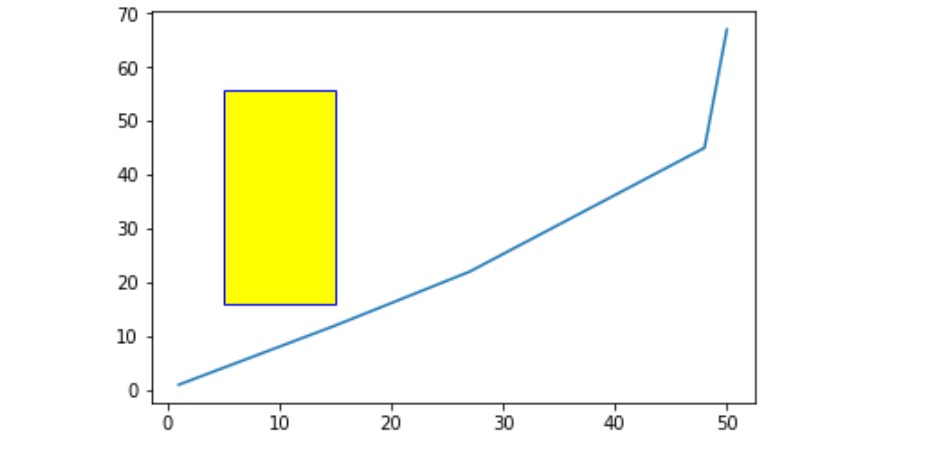
plt.axvspan(5, 15, ymin = 0.25,
            ymax = 0.80, ec ='blue',
            color ='yellow')

plt.show()
輸出:

範例3:
import matplotlib.pyplot as plt


x =[1, 15, 27, 48, 50]
y =[1, 12, 22, 45, 67]

plt.plot(x, y)

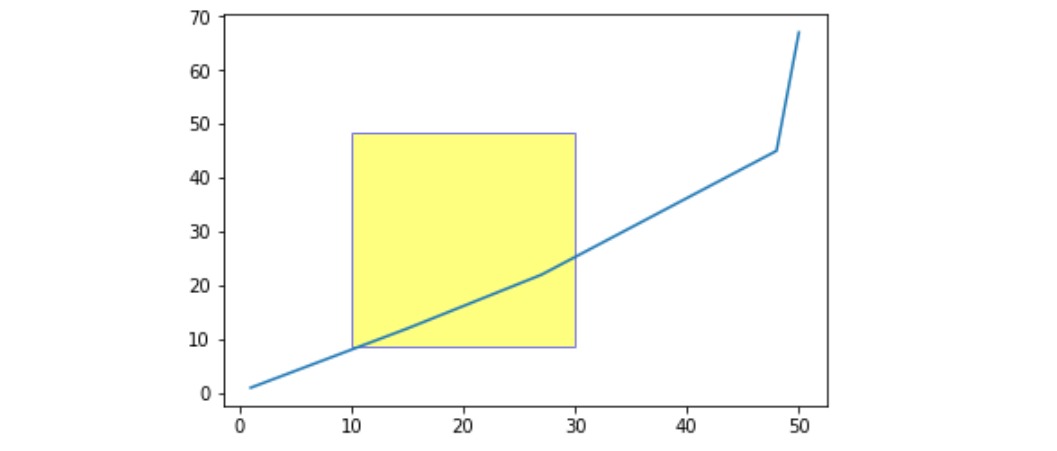
# Setting alpha will make
# the rectangle transparent
plt.axvspan(10, 30, ymin = 0.15,
            ymax = 0.70, ec ='blue',
            color ='yellow',
            alpha = 0.5)

plt.show()
輸出:

相關用法
注:本文由純淨天空篩選整理自sathvik chiramana大神的英文原創作品 Matplotlib.pyplot.axvspan() in Python。非經特殊聲明,原始代碼版權歸原作者所有,本譯文未經允許或授權,請勿轉載或複製。
