Matplotlib是Python中的一个库,它是数字的-NumPy库的数学扩展。它是Python中令人惊叹的可视化库,用于数组的2D图,并用于与更广泛的SciPy堆栈配合使用。
Matplotlib.axis.Axis.get_view_interval()函数
matplotlib库的轴模块中的Axis.get_view_interval()函数用于获取该轴的视图限制(最小,最大)。
用法: Axis.get_view_interval(self)
参数:此方法不接受任何参数。
返回值:此方法返回该轴的视图限制(最小,最大)。
以下示例说明了matplotlib.axis中的matplotlib.axis.Axis.get_view_interval()函数:
范例1:
Python3
# Implementation of matplotlib function
from matplotlib.axis import Axis
import matplotlib.pyplot as plt
import numpy as np

fig = plt.figure()

x = np.linspace(0,4*np.pi,100)
y = 2*np.sin(x)

ax = fig.add_subplot()
ax.plot(x,y)

print("Value return by get_view_interval():")
w = ax.xaxis.get_view_interval()
print(w)

ax.grid()

fig.suptitle("""matplotlib.axis.Axis.get_view_interval()
function Example\n""", fontweight ="bold")

plt.show()
输出:
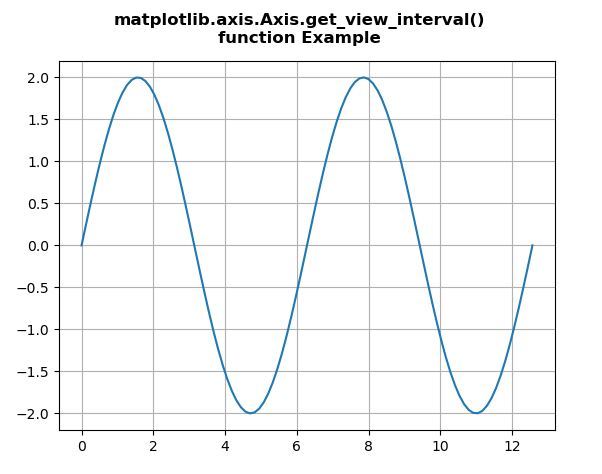
Value return by get_view_interval():
[-0.62831853 13.19468915]
范例2:
Python3
# Implementation of matplotlib function
from matplotlib.axis import Axis
import matplotlib.pyplot as plt
import numpy as np

np.random.seed(10**7)
geeks = np.random.randn(40)

fig, ax = plt.subplots()
ax.acorr(geeks, usevlines = True,
         normed = True,
         maxlags = 20, lw = 3)

ax.grid(True)

print("Value return by get_view_interval():")
w = ax.xaxis.get_view_interval()
print(w)

fig.suptitle("""matplotlib.axis.Axis.get_view_interval()
function Example\n""", fontweight ="bold")

plt.show()
输出:
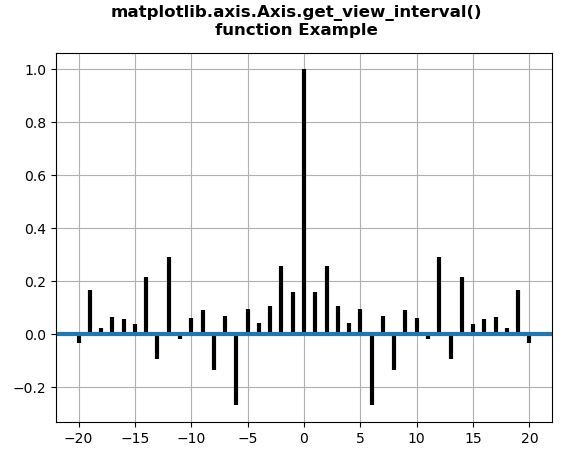
Value return by get_view_interval():
[-22.  22.]
相关用法
- Python Wand function()用法及代码示例
- Python hex()用法及代码示例
- Python now()用法及代码示例
- Python oct()用法及代码示例
- Python int()用法及代码示例
- Python id()用法及代码示例
- Python tell()用法及代码示例
- Python sum()用法及代码示例
- Python ord()用法及代码示例
- Python str()用法及代码示例
- Python cmp()用法及代码示例
- Python dir()用法及代码示例
- Python map()用法及代码示例
- Python fmod()用法及代码示例
- Python globals()用法及代码示例
- Python ldexp()用法及代码示例
注:本文由纯净天空筛选整理自SHUBHAMSINGH10大神的英文原创作品 Matplotlib.axis.Axis.get_view_interval() function in Python。非经特殊声明,原始代码版权归原作者所有,本译文未经允许或授权,请勿转载或复制。