Matplotlib是Python中的一个库,它是数字的-NumPy库的数学扩展。它是Python中令人惊叹的可视化库,用于数组的2D图,并用于与更广泛的SciPy堆栈配合使用。
matplotlib.axis.Axis.get_tick_space()函数
matplotlib库的轴模块中的Axis.get_tick_space()函数用于获取可适合该轴的估计刻度数。
用法: Axis.get_tick_space(self)
参数:此方法不接受任何参数。
返回值:此方法返回可适合该轴的估计刻度数。
以下示例说明了matplotlib.axis中的matplotlib.axis.Axis.get_tick_space()函数:
范例1:
Python3
# Implementation of matplotlib function
from matplotlib.axis import Axis
import matplotlib.pyplot as plt
import numpy as np


X = np.arange(-5, 5, 1)
Y = np.arange(-5, 5, 1)
U, V = np.meshgrid(X, Y)

fig, ax = plt.subplots()
ax.quiver(X, Y, U, V)

w = ax.xaxis.get_tick_space()

print("Value Return:\n"+str(w))

fig.suptitle("""matplotlib.axis.Axis.get_tick_space()
function Example\n""", fontweight ="bold")

plt.show()
输出:
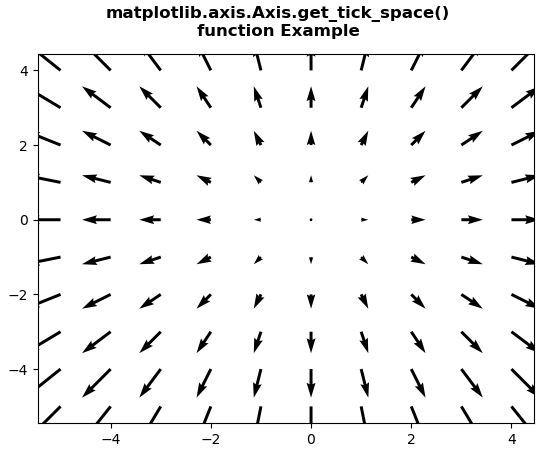
Value Return:
11
范例2:
Python3
# Implementation of matplotlib function
from matplotlib.axis import Axis
import numpy as np
import matplotlib.pyplot as plt

fig, ax2 = plt.subplots(sharex = True)
fig.subplots_adjust(left=0.2, wspace=0.6)
box = dict(facecolor='green', pad=5, alpha=0.2)

ax2.plot(20*np.random.rand(10))
ax2.set_xlabel('X - Label', bbox=box)
ax2.set_xlim(0, 10)
Axis.set_label_coords(ax2.xaxis, 0.5, 0.95)

w = ax2.xaxis.get_tick_space()

print("Value Return:\n"+str(w))

fig.suptitle("""matplotlib.axis.Axis.get_tick_space()
function Example\n""", fontweight ="bold")

plt.show()
输出:
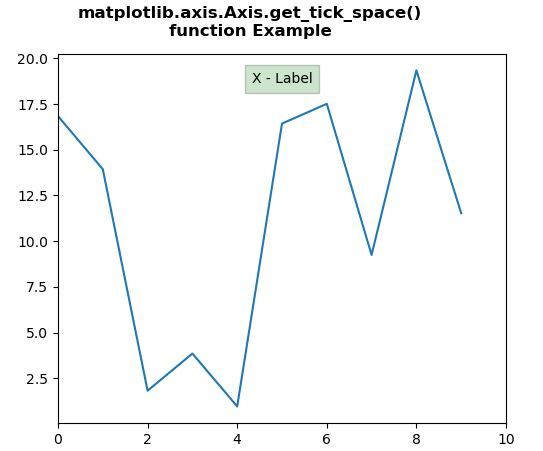
Value Return:
10
相关用法
- Python Wand function()用法及代码示例
- Python str()用法及代码示例
- Python cmp()用法及代码示例
- Python ord()用法及代码示例
- Python sum()用法及代码示例
- Python map()用法及代码示例
- Python hex()用法及代码示例
- Python oct()用法及代码示例
- Python tell()用法及代码示例
- Python dir()用法及代码示例
- Python id()用法及代码示例
- Python now()用法及代码示例
- Python int()用法及代码示例
- Python statistics mean()用法及代码示例
- Python cmath.sin()用法及代码示例
- Python reversed()用法及代码示例
注:本文由纯净天空筛选整理自SHUBHAMSINGH10大神的英文原创作品 Matplotlib.axis.Axis.get_tick_space() function in Python。非经特殊声明,原始代码版权归原作者所有,本译文未经允许或授权,请勿转载或复制。