Matplotlib是Python中的一个库,它是数字的-NumPy库的数学扩展。它是Python中令人惊叹的可视化库,用于数组的2D图,并用于与更广泛的SciPy堆栈配合使用。
Matplotlib.axis.Axis.get_figure()函数
matplotlib库的axis模块中的Axis.get_figure()函数用于获取艺术家所属的Figure实例。
用法: Axis.get_figure(self)
参数:此方法不接受任何参数。
返回值:此方法返回艺术家所属的Figure实例。
以下示例说明了matplotlib.axis中的matplotlib.axis.Axis.get_figure()函数:
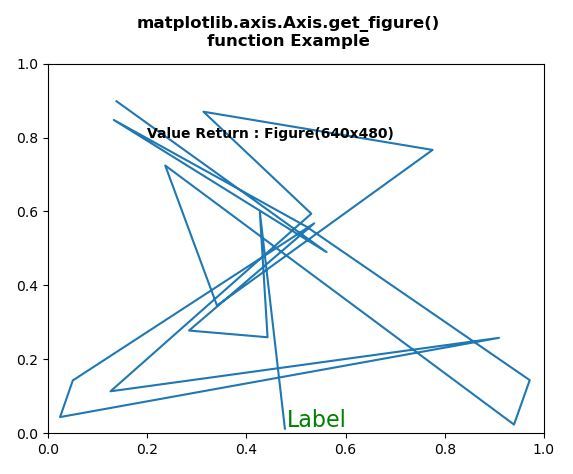
范例1:
Python3
# Implementation of matplotlib function
from matplotlib.axis import Axis
import numpy as np
import matplotlib.pyplot as plt
import matplotlib.lines as lines
import matplotlib.transforms as mtransforms
import matplotlib.text as mtext


class GFGfun(lines.Line2D):

    def __init__(self, *args, **kwargs):
        self.text = mtext.Text(0, 0, '')
        lines.Line2D.__init__(self, *args, **kwargs)
        self.text.set_text(self.get_label())

    def set_figure(self, figure):
        self.text.set_figure(figure)
        lines.Line2D.set_figure(self, figure)

    def set_axes(self, axes):
        self.text.set_axes(axes)
        lines.Line2D.set_axes(self, axes)

    def set_transform(self, transform):
        # 2 pixel offset
        texttrans = transform + mtransforms.Affine2D().translate(2, 2)
        self.text.set_transform(texttrans)
        lines.Line2D.set_transform(self, transform)

    def set_data(self, x, y):
        if len(x):
            self.text.set_position((x[-1], y[-1]))

        lines.Line2D.set_data(self, x, y)

    def draw(self, renderer):
        lines.Line2D.draw(self, renderer)
        self.text.draw(renderer)


np.random.seed(10**7)

fig, ax = plt.subplots()
x, y = np.random.rand(2, 20)
line = GFGfun(x, y, mfc ='green',
              ms = 12,
              label ='Label')

line.text.set_color('green')
line.text.set_fontsize(16)

ax.add_line(line)

ax.text(0.2, 0.8, "Value Return:"
        +str(Axis.get_figure(ax)),
        fontweight ="bold")

fig.suptitle("""matplotlib.axis.Axis.get_figure()
function Example\n""", fontweight ="bold")

plt.show()
输出:
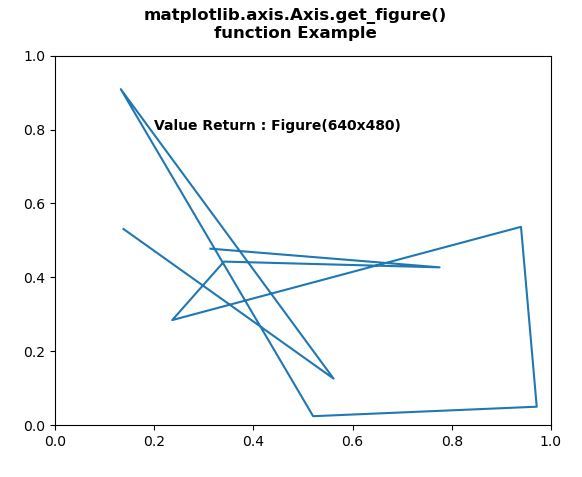
范例2:
Python3
# Implementation of matplotlib function
from matplotlib.axis import Axis
import numpy as np
import matplotlib.pyplot as plt
import matplotlib.lines as lines
import matplotlib.transforms as mtransforms
import matplotlib.text as mtext


class GFGfun(lines.Line2D):

    def __init__(self, *args, **kwargs):
        self.text = mtext.Text(0, 0, '')
        lines.Line2D.__init__(self, *args, **kwargs)
        self.text.set_text(self.get_label())

    def set_figure(self, figure):
        self.text.set_figure(figure)
        lines.Line2D.set_figure(self, figure)


np.random.seed(10**7)


fig, ax = plt.subplots()
x, y = np.random.rand(2, 10)
line = GFGfun(x, y,
              mfc ='green', ms = 12, label ='Label')

line.text.set_color('green')
line.text.set_fontsize(16)

ax.add_line(line)

ax.text(0.2, 0.8, "Value Return:"
        +str(Axis.get_figure(ax)),
        fontweight ="bold")

fig.suptitle("""matplotlib.axis.Axis.get_figure()
function Example\n""", fontweight ="bold")

plt.show()
输出:
相关用法
- Python Wand function()用法及代码示例
- Python ord()用法及代码示例
- Python tell()用法及代码示例
- Python cmp()用法及代码示例
- Python sum()用法及代码示例
- Python id()用法及代码示例
- Python int()用法及代码示例
- Python dir()用法及代码示例
- Python str()用法及代码示例
- Python hex()用法及代码示例
- Python now()用法及代码示例
- Python map()用法及代码示例
- Python oct()用法及代码示例
- Python vars()用法及代码示例
- Python fsum()用法及代码示例
注:本文由纯净天空筛选整理自SHUBHAMSINGH10大神的英文原创作品 Matplotlib.axis.Axis.get_figure() function in Python。非经特殊声明,原始代码版权归原作者所有,本译文未经允许或授权,请勿转载或复制。