Matplotlib是Python中的一个库,它是数字的-NumPy库的数学扩展。它是Python中令人惊叹的可视化库,用于数组的2D图,并用于与更广泛的SciPy堆栈配合使用。
Matplotlib.axis.Axis.get_children()函数
matplotlib库的axis模块中的Axis.get_children()函数用于获取此Artist的子Artist的列表。
用法: Axis.get_children(self)
参数:此方法不接受任何参数。
返回值:此方法返回此艺术家的子艺术家列表。
以下示例说明了matplotlib.axis中的matplotlib.axis.Axis.get_children()函数:
范例1:
Python3
# Implementation of matplotlib function
from matplotlib.axis import Axis
import matplotlib.pyplot as plt
from matplotlib.lines import Line2D
import numpy as np
from numpy.random import rand


fig, ax2 = plt.subplots()

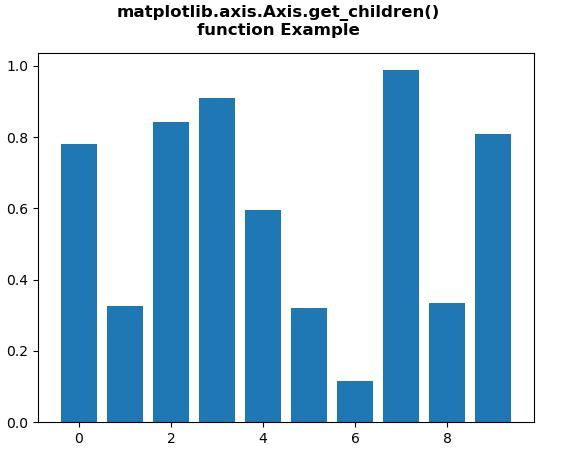
ax2.bar(range(10), rand(10), picker = True)

print("List of the child Artists of this Artist \n",
      *list(ax2.get_children()), sep ="\n")

fig.suptitle("""matplotlib.axis.Axis.get_children()
function Example\n""", fontweight ="bold")

plt.show()
输出:

List of the child Artists of this Artist
Rectangle(xy=(-0.4, 0), width=0.8, height=0.78207, angle=0)
Rectangle(xy=(0.6, 0), width=0.8, height=0.325622, angle=0)
Rectangle(xy=(1.6, 0), width=0.8, height=0.842425, angle=0)
Rectangle(xy=(2.6, 0), width=0.8, height=0.909971, angle=0)
Rectangle(xy=(3.6, 0), width=0.8, height=0.595848, angle=0)
Rectangle(xy=(4.6, 0), width=0.8, height=0.320727, angle=0)
Rectangle(xy=(5.6, 0), width=0.8, height=0.114932, angle=0)
Rectangle(xy=(6.6, 0), width=0.8, height=0.987785, angle=0)
Rectangle(xy=(7.6, 0), width=0.8, height=0.333873, angle=0)
Rectangle(xy=(8.6, 0), width=0.8, height=0.808235, angle=0)
Spine
Spine
Spine
Spine
XAxis(80.0,52.8)
YAxis(80.0,52.8)
Text(0.5, 1.0, ”)
Text(0.0, 1.0, ”)
Text(1.0, 1.0, ”)
Rectangle(xy=(0, 0), width=1, height=1, angle=0)
范例2:
Python3
# Implementation of matplotlib function
from matplotlib.axis import Axis
import matplotlib.pyplot as plt
import numpy as np
from matplotlib.patches import Ellipse


NUM = 20

ells = [Ellipse(xy = np.random.rand(2) * 10,
                width = np.random.rand(),
                height = np.random.rand(),
                angle = np.random.rand() * 360)
        for i in range(NUM)]

fig, ax = plt.subplots(subplot_kw ={'aspect':'equal'})

print("List of the child Artists of this Artist \n")
for e in ells:
    ax.add_artist(e)
    e.set_clip_box(ax.bbox)
    e.set_alpha(np.random.rand())
    e.set_facecolor(np.random.rand(4))

print(*list(ax.get_children()), sep = "\n")

ax.set_xlim(3, 7)
ax.set_ylim(3, 7)

fig.suptitle("""matplotlib.axis.Axis.get_children()
function Example\n""", fontweight ="bold")

plt.show()
输出:

List of the child Artists of this Artist
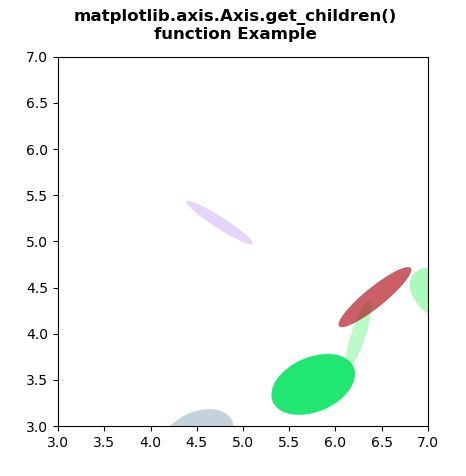
Ellipse(xy=(6.251681831206875, 3.9966267142138587), width=0.15749720821862734, height=0.7428173898961268, angle=341.64959566060367)
Ellipse(xy=(9.694635171651406, 0.3082298935840244), width=0.43785045383108245, height=0.5349266430528582, angle=306.89814087621284)
Ellipse(xy=(1.7357826484106653, 5.411309227201636), width=0.10663934602041314, height=0.43026995252196254, angle=256.6550881336492)
Ellipse(xy=(3.6968381788725226, 9.185987209652344), width=0.6813936640135215, height=0.25300689364125084, angle=252.61131568683595)
Ellipse(xy=(7.699729644035633, 9.05640867578855), width=0.27584531777538246, height=0.6852202435681556, angle=292.8551318911685)
Ellipse(xy=(3.8055234086669287, 9.303529689962627), width=0.3397616810032148, height=0.6800670944101653, angle=343.3599117442074)
Ellipse(xy=(5.760077545935722, 3.452051266745666), width=0.9523325408974765, height=0.5890811048552818, angle=23.154917565279685)
Ellipse(xy=(0.3028385509275022, 4.348405082376353), width=0.29073052124332044, height=0.7227343559726833, angle=291.6625420556584)
Ellipse(xy=(9.356848125562445, 0.388682744998603), width=0.7551391376559045, height=0.6689726402915265, angle=29.506282994528185)
Ellipse(xy=(4.5026337961862914, 2.8818563718011103), width=0.8383255618923418, height=0.5404731893991847, angle=205.60591248148282)
Ellipse(xy=(2.4392204512519946, 3.716967027629586), width=0.477237973974457, height=0.45092408521984695, angle=9.23863308260383)
Ellipse(xy=(1.693675453843294, 5.900630379457623), width=0.8725010196211161, height=0.7887736908331072, angle=346.47313864001734)
Ellipse(xy=(3.2261195027672707, 7.391400830802653), width=0.3786901514172035, height=0.7575240210476083, angle=341.9665543049055)
Ellipse(xy=(6.427754122446987, 4.396519757211291), width=0.9987780502142212, height=0.21677557044006557, angle=39.01953674151486)
Ellipse(xy=(9.542282251932058, 6.243441448874013), width=0.7181816586220924, height=0.34087193115902903, angle=107.85345758940194)
Ellipse(xy=(0.8126321922507262, 7.229081778048356), width=0.5429698490137819, height=0.9121160656974833, angle=354.48399372344613)
Ellipse(xy=(1.5697931692991618, 6.184965389960491), width=0.13800615477220446, height=0.29905434238318707, angle=74.44925403071619)
Ellipse(xy=(4.74844769967898, 5.202457759166937), width=0.8517498537889671, height=0.12566779514902027, angle=327.3770326727686)
Ellipse(xy=(7.226241075132654, 4.391600128715984), width=0.5438182944679767, height=0.9198000527055847, angle=60.3333173286636)
Ellipse(xy=(1.0311974235486987, 0.7069241263763404), width=0.9927688013269673, height=0.30152706004900354, angle=244.07742718276535)
Spine
Spine
Spine
Spine
XAxis(80.0,52.8)
YAxis(80.0,52.8)
Text(0.5, 1.0, ”)
Text(0.0, 1.0, ”)
Text(1.0, 1.0, ”)
Rectangle(xy=(0, 0), width=1, height=1, angle=0)
相关用法
- Python Wand function()用法及代码示例
- Python now()用法及代码示例
- Python dir()用法及代码示例
- Python hex()用法及代码示例
- Python cmp()用法及代码示例
- Python int()用法及代码示例
- Python id()用法及代码示例
- Python ord()用法及代码示例
- Python str()用法及代码示例
- Python tell()用法及代码示例
- Python map()用法及代码示例
- Python oct()用法及代码示例
- Python sum()用法及代码示例
- Python strftime()用法及代码示例
- Python compile()用法及代码示例
- Python cmath.sin()用法及代码示例
注:本文由纯净天空筛选整理自SHUBHAMSINGH10大神的英文原创作品 Matplotlib.axis.Axis.get_children() function in Python。非经特殊声明,原始代码版权归原作者所有,本译文未经允许或授权,请勿转载或复制。
