Matplotlib是Python中的一个库,它是数字的-NumPy库的数学扩展。轴类包含大多数图形元素:Axis,Tick,Line2D,Text,Polygon等,并设置坐标系。 Axes实例通过callbacks属性支持回调。
matplotlib.axes.Axes.vlines()函数
matplotlib库的axiss模块中的Axes.vlines()函数用于在从ymin到ymax的每个x处绘制垂直线。
用法: Axes.vlines(self, x, ymin, ymax, colors=’k’, linestyles=’solid’, label=”, *, data=None, **kwargs)
参数:此方法接受以下描述的参数:
- x:该参数是x-indexes绘制线条的顺序。
- ymin, ymax:这些参数包含一个数组,它们代表每行的开头和结尾。
- colors:此参数是可选参数。它是默认值为k的线条的颜色。
- linetsyle:此参数也是可选参数。它用于表示线型{'实线','虚线','虚线','虚线'}。
- label:该参数也是可选参数,它是图形的标签。
返回值:这将返回LineCollection。
以下示例说明了matplotlib.axes中的matplotlib.axes.Axes.vlines()函数:
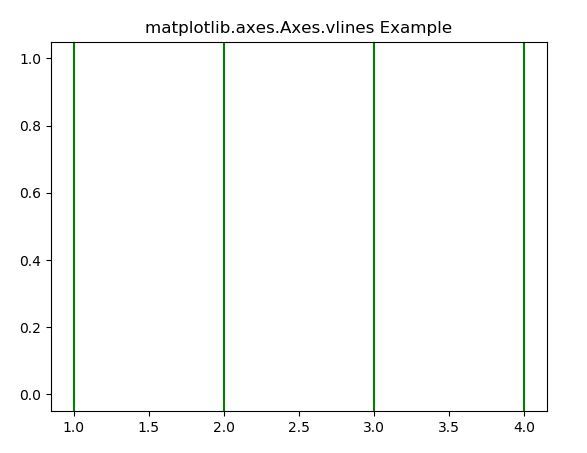
范例1:
# Implementation of matplotlib function

import numpy as np
from matplotlib import patches
import matplotlib.pyplot as plt

fig, ax = plt.subplots()
ax.vlines([1, 2, 3, 4], 0, 1,
          color ="green",
          transform = ax.get_xaxis_transform())

ax.set_title('matplotlib.axes.Axes.vlines Example')

plt.show()
输出:
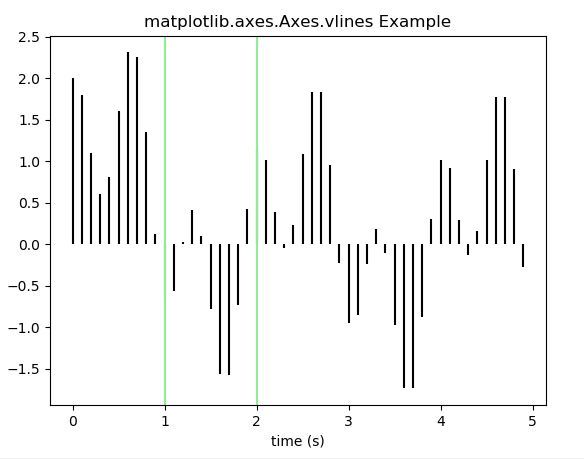
范例2:
# Implementation of matplotlib function

import numpy as np
from matplotlib import patches
import matplotlib.pyplot as plt

t = np.arange(0.0, 5.0, 0.1)
s = np.exp(-t) + np.cos(3 * np.pi * t) + np.sin(np.pi * t)
nse = np.random.normal(0.0, 0.8, t.shape) * s

fig, ax = plt.subplots()

ax.vlines(t, [0], s)
ax.vlines([1, 2], 0, 1, color ="lightgreen",
          transform = ax.get_xaxis_transform())

ax.set_xlabel('time (s)')
ax.set_title('matplotlib.axes.Axes.vlines Example')

plt.show()
输出:
相关用法
注:本文由纯净天空筛选整理自SHUBHAMSINGH10大神的英文原创作品 matplotlib.axes.Axes.vlines() in Python。非经特殊声明,原始代码版权归原作者所有,本译文未经允许或授权,请勿转载或复制。