Matplotlib是Python中的一个库,它是数字的-NumPy库的数学扩展。轴类包含大多数图形元素:Axis,Tick,Line2D,Text,Polygon等,并设置坐标系。 Axes实例通过callbacks属性支持回调。
matplotlib.axes.Axes.set_label()函数
matplotlib库的axiss模块中的Axes.set_label()函数用于设置将在图例中显示的标签。
用法: Axes.set_label(self, s)
参数:此方法仅接受一个参数。
- s:通过调用str,此参数将转换为字符串。
返回值:此方法不返回任何值。
以下示例说明了matplotlib.axes中的matplotlib.axes.Axes.set_label()函数:
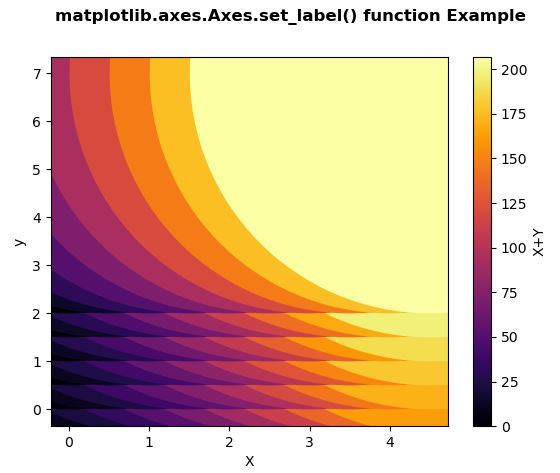
范例1:
# Implementation of matplotlib function
import matplotlib.pyplot as plt
import numpy as np
from matplotlib.collections import EllipseCollection


x = np.arange(10)
y = np.arange(15)
X, Y = np.meshgrid(x, y)

XY = np.column_stack((X.ravel(), Y.ravel()))

fig, ax = plt.subplots()

ec = EllipseCollection(10, 10, 5, units ='y',
                       offsets = XY * 0.5,
                       transOffset = ax.transData,
                       cmap ="inferno")

ec.set_array((X * Y + X * X).ravel())

ax.add_collection(ec)
ax.autoscale_view()

ax.set_xlabel('X')
ax.set_ylabel('y')

cbar = plt.colorbar(ec)
cbar.set_label('X + Y')

fig.suptitle('matplotlib.axes.Axes.set_label() function \
Example\n', fontweight ="bold")

fig.canvas.draw()

plt.show()
输出:
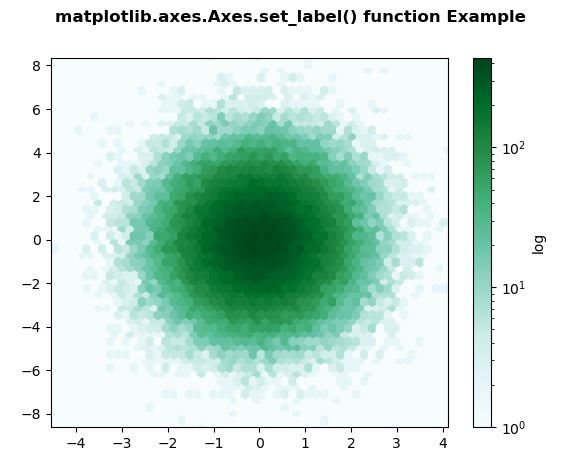
范例2:
# Implementation of matplotlib function
import matplotlib.pyplot as plt
import numpy as np


np.random.seed(19680801)

n = 100000
x = np.random.standard_normal(n)
y = 2 * np.random.standard_normal(n)
z =[1, 2, 3, 4]

xmin = x.min()
xmax = x.max()
ymin = y.min()
ymax = y.max()

fig, ax = plt.subplots()
hb = ax.hexbin(x, y, gridsize = 50, bins ='log', cmap ='BuGn')
ax.set(xlim =(xmin, xmax), ylim =(ymin, ymax))

cb = fig.colorbar(hb, ax = ax)
cb.set_label('log')

fig.suptitle('matplotlib.axes.Axes.set_label() function\
 Example\n', fontweight ="bold")

fig.canvas.draw()

plt.show()
输出:
相关用法
注:本文由纯净天空筛选整理自SHUBHAMSINGH10大神的英文原创作品 Matplotlib.axes.Axes.set_label() in Python。非经特殊声明,原始代码版权归原作者所有,本译文未经允许或授权,请勿转载或复制。