Matplotlib是Python中的一个库,它是数字的-NumPy库的数学扩展。轴类包含大多数图形元素:Axis,Tick,Line2D,Text,Polygon等,并设置坐标系。 Axes实例通过callbacks属性支持回调。
matplotlib.axes.Axes.semilogx()函数
matplotlib库的axiss模块中的Axes.semilogx()函数用于绘制在x轴上具有对数比例的图。
用法:
Axes.semilogx(self, *args, **kwargs)
参数:此方法接受以下描述的参数:
- basex:此参数是x对数的底,是可选参数,默认值为10。
- subsx:此参数是次要X刻度的位置顺序,并且是可选的。
- nonposx:此参数是x中的非正值,可以将其掩盖为无效值,或裁剪为非常小的正数。
返回值:这将返回以下内容:
- lines:这将返回代表绘制数据的Line2D对象的列表。
以下示例说明了matplotlib.axes中的matplotlib.axes.Axes.semilogx()函数:
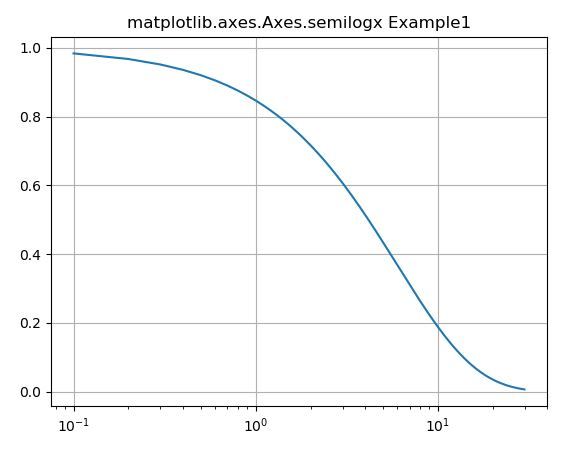
示例1:
# Implementation of matplotlib function

import numpy as np
import matplotlib.pyplot as plt

fig, ax = plt.subplots()

dt = 0.1
test = np.arange(dt, 30.0, dt)

ax.semilogx(test, np.exp(-test / 6.0))
ax.grid()

ax.set_title('matplotlib.axes.Axes.semilogx Example1')
plt.show()
输出:
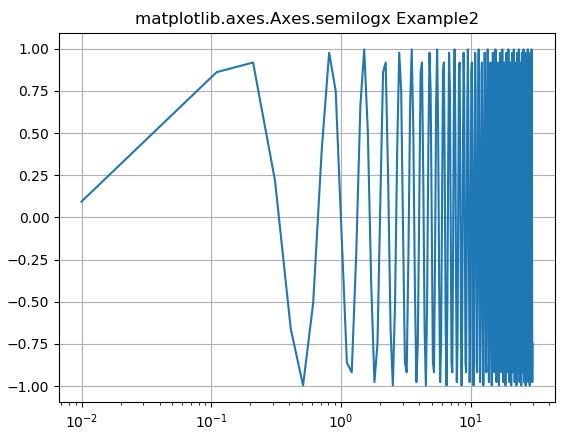
示例2:
# Implementation of matplotlib function

import numpy as np
import matplotlib.pyplot as plt

test = np.arange(0.01, 30.0, 0.1)

# Create figure
fig, ax = plt.subplots()


# log x axis
ax.semilogx(test, np.sin(3 * np.pi * test))
ax.grid()


ax.set_title('matplotlib.axes.Axes.semilogx Example2')
plt.show()
输出:
相关用法
注:本文由纯净天空筛选整理自SHUBHAMSINGH10大神的英文原创作品 matplotlib.axes.Axes.semilogx() in Python。非经特殊声明,原始代码版权归原作者所有,本译文未经允许或授权,请勿转载或复制。