Matplotlib是Python中的一个库,它是数字的-NumPy库的数学扩展。轴类包含大多数图形元素:Axis,Tick,Line2D,Text,Polygon等,并设置坐标系。 Axes实例通过callbacks属性支持回调。
matplotlib.axes.Axes.hexbin()函数
matplotlib库的axiss模块中的Axes.hexbin()函数用于制作点x,y,
用法: Axes.hexbin(self, x, y, C=None, gridsize=100, bins=None, xscale=’linear’, yscale=’linear’, extent=None, cmap=None, norm=None, vmin=None, vmax=None, alpha=None, linewidths=None, edgecolors=’face’, reduce_C_function=, mincnt=None, marginals=False, *, data=None, **kwargs)
参数:此方法接受以下描述的参数:
- x, y:这些参数是数据序列。 x和y的长度必须相同。
- C:此参数是存储在箱中的值。
- gridsize:此参数表示x方向或两个方向上的六边形数量。
- xscale:此参数在水平轴上使用线性或对数刻度。
- xycale:此参数在垂直轴上使用线性或log10标度。
- mincnt:此参数用于显示单元格中具有最少点数的单元格。
- marginals:此参数用于沿x轴底部和y轴左侧绘制颜色映射为矩形的边际密度。
- extent:此参数是箱子的极限。
返回值:这将返回以下内容:
- 多重集合:这将返回定义六角形框的PolyCollection。
以下示例说明了matplotlib.axes中的matplotlib.axes.Axes.hexbin()函数:
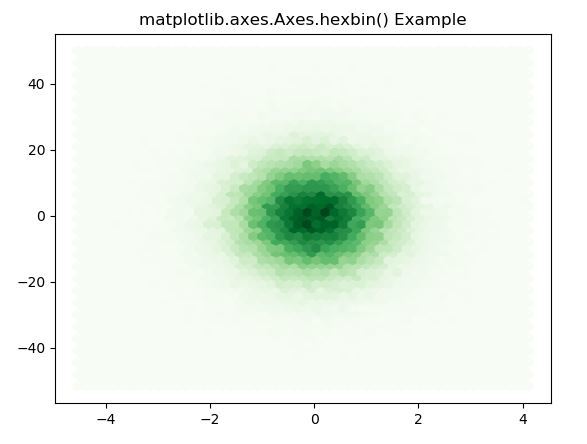
示例1:
# Implementation of matplotlib function
import matplotlib.pyplot as plt
import numpy as np

np.random.seed(19680801)

n = 100000
x = np.random.standard_normal(n)
y = 12 * np.random.standard_normal(n)

fig, ax = plt.subplots()
ax.hexbin(x, y, gridsize = 50, cmap ='Greens')
ax.set_title('matplotlib.axes.Axes.hexbin() Example')
plt.show()
输出:
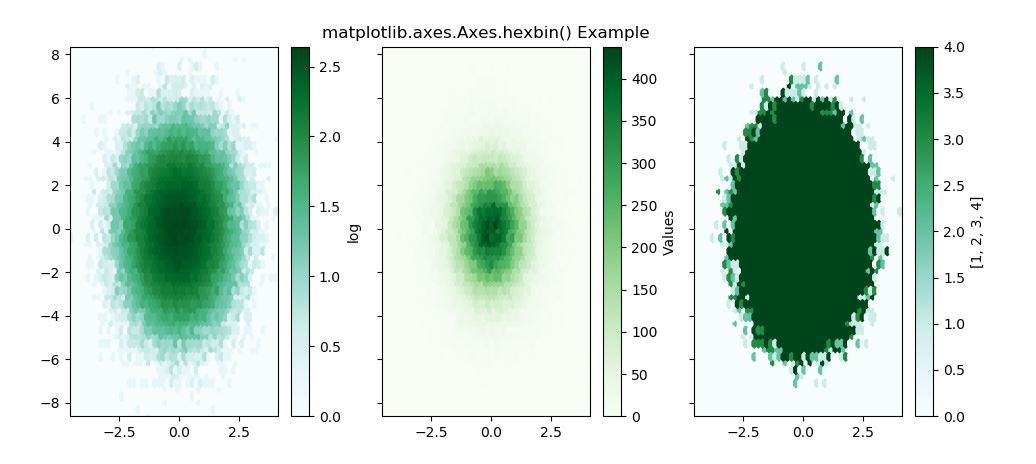
示例2:
# Implementation of matplotlib function
import matplotlib.pyplot as plt
import numpy as np

np.random.seed(19680801)

n = 100000
x = np.random.standard_normal(n)
y = 2 * np.random.standard_normal(n)
z =[1, 2, 3, 4]
xmin = x.min()
xmax = x.max()
ymin = y.min()
ymax = y.max()

fig, axs = plt.subplots(ncols = 3,
                        sharey = True)

ax = axs[0]
hb = ax.hexbin(x, y, gridsize = 50,
               bins ='log',
               cmap ='BuGn')

ax.set(xlim =(xmin, xmax),
       ylim =(ymin, ymax))

cb = fig.colorbar(hb, ax = ax)
cb.set_label('log')

ax = axs[1]
hb = ax.hexbin(x, y, gridsize = 50,
               cmap ='Greens')

ax.set(xlim =(xmin, xmax),
       ylim =(ymin, ymax))

cb = fig.colorbar(hb, ax = ax)
cb.set_label('Values')

ax.set_title('matplotlib.axes.Axes.\
hexbin() Example')

ax = axs[2]
hb = ax.hexbin(x, y, gridsize = 50,
               bins = z, cmap ='BuGn')

ax.set(xlim =(xmin, xmax),
       ylim =(ymin, ymax))

cb = fig.colorbar(hb, ax = ax)
cb.set_label(z)
plt.show()
输出:
相关用法
注:本文由纯净天空筛选整理自SHUBHAMSINGH10大神的英文原创作品 Matplotlib.axes.Axes.hexbin() in Python。非经特殊声明,原始代码版权归原作者所有,本译文未经允许或授权,请勿转载或复制。