Matplotlib是Python中的一个库,它是数字的-NumPy库的数学扩展。轴类包含大多数图形元素:Axis,Tick,Line2D,Text,Polygon等,并设置坐标系。 Axes实例通过callbacks属性支持回调。
matplotlib.axes.Axes.get_ylabel()函数
matplotlib库的axiss模块中的Axes.get_ylabel()函数用于获取ylabel文本字符串。
用法: Axes.get_ylabel(self)
参数:此方法不接受任何参数。
返回:此函数返回ylabel文本字符串。
以下示例说明了matplotlib.axes中的matplotlib.axes.Axes.get_ylabel()函数:
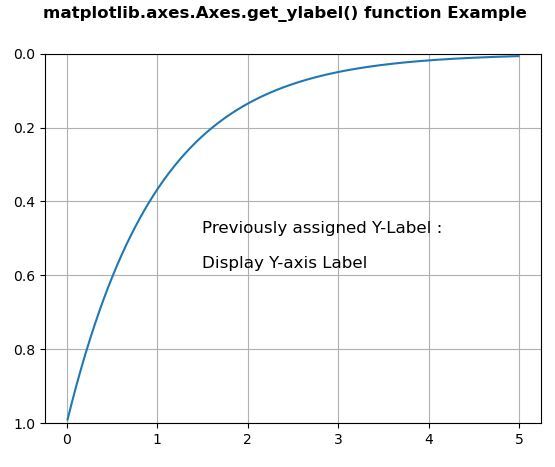
范例1:
import matplotlib.pyplot as plt
import numpy as np

t = np.arange(0.01, 5.0, 0.01)
s = np.exp(-t)

fig, ax = plt.subplots()

ax.plot(t, s)
ax.set_ylim(1, 0)
ax.set_ylabel('Display Y-axis Label', fontweight ='bold')
ax.grid(True)

w = ax.get_ylabel()
ax.set_ylabel("")
ax.text(1.5, 0.58, "Previously assigned Y-Label:\n\n"+str(w),
       fontsize = 12)
fig.suptitle("matplotlib.axes.Axes.get_ylabel() function\
 Example\n", fontweight ="bold")
plt.show()
输出:
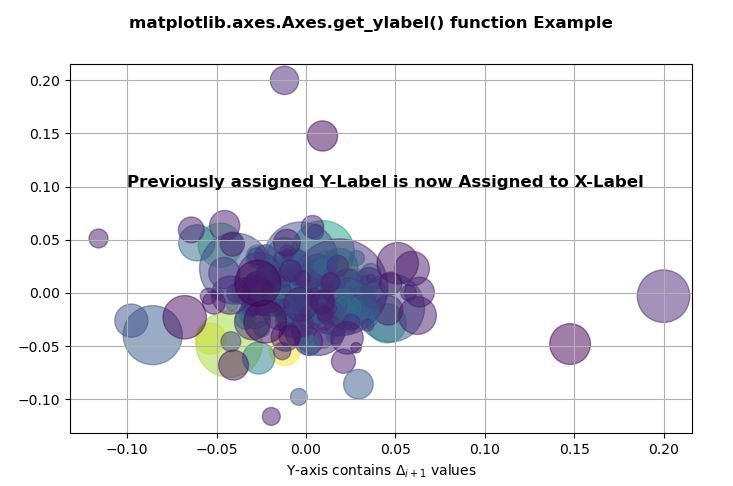
范例2:
# Implementation of matplotlib function
import numpy as np
import matplotlib.pyplot as plt
import matplotlib.cbook as cbook

with cbook.get_sample_data('goog.npz') as datafile:
    price_data = np.load(datafile)['price_data'].view(np.recarray)
price_data = price_data[-250:]  # get the most recent 250 trading days

delta1 = np.diff(price_data.adj_close) / price_data.adj_close[:-1]

volume = (25 * price_data.volume[:-2] / price_data.volume[0])**(2.2)
close = (0.03 * price_data.close[:-2] / 0.03 * price_data.open[:-2])**2

fig, ax = plt.subplots()
ax.scatter(delta1[:-1], delta1[1:],
           c = close, s = volume,
           alpha = 0.5)

ax.set_ylabel(r'Y-axis contains $\Delta_{i + 1}$ values',
              fontweight ='bold')
ax.grid(True)

w = ax.get_ylabel()
ax.set_ylabel("")
ax.set_xlabel(w)
ax.text(-0.1, 0.1, "Previously assigned Y-Label is now Assigned\
to X-Label", fontsize = 12, fontweight ="bold")

fig.suptitle("matplotlib.axes.Axes.get_ylabel() function \
Example\n", fontweight ="bold")
plt.show()
输出:
相关用法
注:本文由纯净天空筛选整理自SHUBHAMSINGH10大神的英文原创作品 Matplotlib.axes.Axes.get_ylabel() in Python。非经特殊声明,原始代码版权归原作者所有,本译文未经允许或授权,请勿转载或复制。