Matplotlib是Python中的一个库,它是数字的-NumPy库的数学扩展。轴类包含大多数图形元素:Axis,Tick,Line2D,Text,Polygon等,并设置坐标系。 Axes实例通过callbacks属性支持回调。
matplotlib.axes.Axes.eventplot()函数
matplotlib库的axiss模块中的Axes.eventplot()函数用于在给定位置绘制相同的平行线。
用法: Axes.eventplot(self, positions, orientation=’horizontal’, lineoffsets=1, linelengths=1, linewidths=None, colors=None, linestyles=’solid’, *, data=None, **kwargs)
参数:此方法接受以下描述的参数:
- positions:此参数是对象的序列,每个值是一个事件。
- orientation:此参数用于控制事件集合{“水平”,“垂直”}的方向。
- lineoffsets:此参数是线的中心在与方向正交的方向上偏离原点的偏移量。
- linelengths:此参数是线条的总高度。
- linewidths:此参数是事件线的线宽(以磅为单位)。
返回值:这将返回以下内容:
- list:这将返回EventCollection对象的列表。
以下示例说明了matplotlib.axes中的matplotlib.axes.Axes.eventplot()函数:
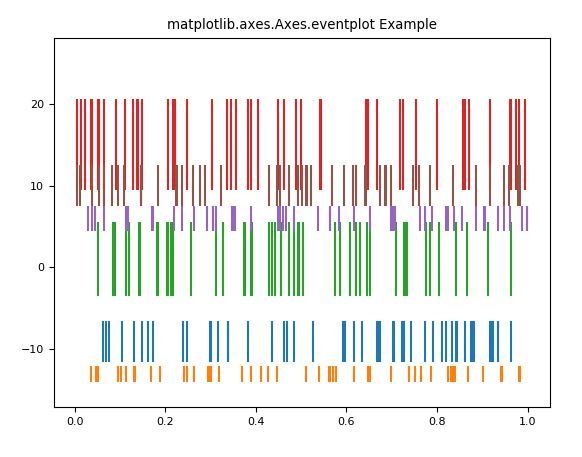
范例1:
#Implementation of matplotlib function
import numpy as np
import matplotlib.pyplot as plt
import matplotlib


matplotlib.rcParams['font.size'] = 8.0

np.random.seed(789680)
data1 = np.random.random([6, 50])

colors1 = ['C{}'.format(i) for i in range(6)]
lineoffsets1 = np.array([-9, -13, 1,
                         15, 6, 10])

linelengths1 = [5, 2, 9, 11, 3, 5]

fig, axs = plt.subplots()
axs.eventplot(data1, colors=colors1,
              lineoffsets=lineoffsets1,
              linelengths=linelengths1)

axs.set_title('matplotlib.axes.Axes.eventplot Example')
plt.show()
输出:
范例2:
# Implementation of matplotlib function
import numpy as np
import matplotlib.pyplot as plt
import matplotlib


matplotlib.rcParams['font.size'] = 8.0

np.random.seed(789680)
data1 = np.random.gamma(4, size =[60, 50])

lineoffsets1 = 1
linelengths1 = 1

fig, [axs1, axs2]= plt.subplots(2, 1)
axs1.eventplot(data1, colors ='green',
               lineoffsets = lineoffsets1,
               linelengths = linelengths1)

axs2.eventplot(data1, colors ='green',
               lineoffsets = lineoffsets1,
               linelengths = linelengths1,
               orientation ='vertical')

axs1.set_title('matplotlib.axes.Axes.eventplot Example')
plt.show()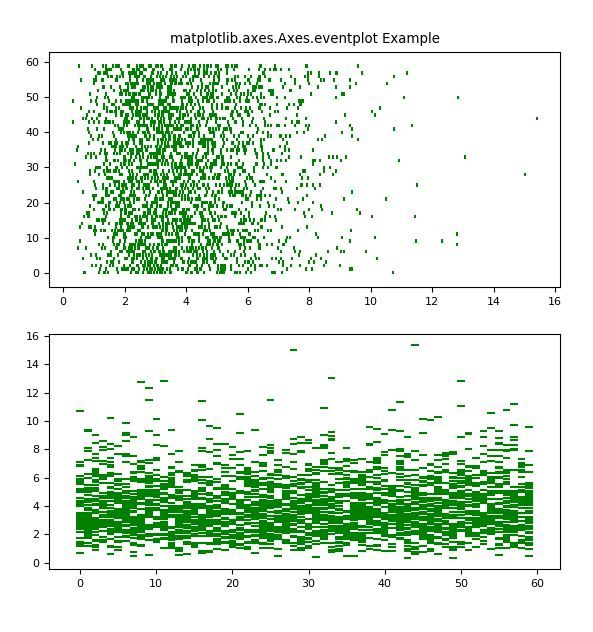
相关用法
注:本文由纯净天空筛选整理自SHUBHAMSINGH10大神的英文原创作品 Matplotlib.axes.Axes.eventplot() in Python。非经特殊声明,原始代码版权归原作者所有,本译文未经允许或授权,请勿转载或复制。