繪圖調整搜索結果
用法
# S3 method for tune_results
autoplot(
  object,
  type = c("marginals", "parameters", "performance"),
  metric = NULL,
  width = NULL,
  ...
)
參數
- object
-
tune_grid()或tune_bayes()的結果的一小部分。 - type
-
單個字符值。選項包括
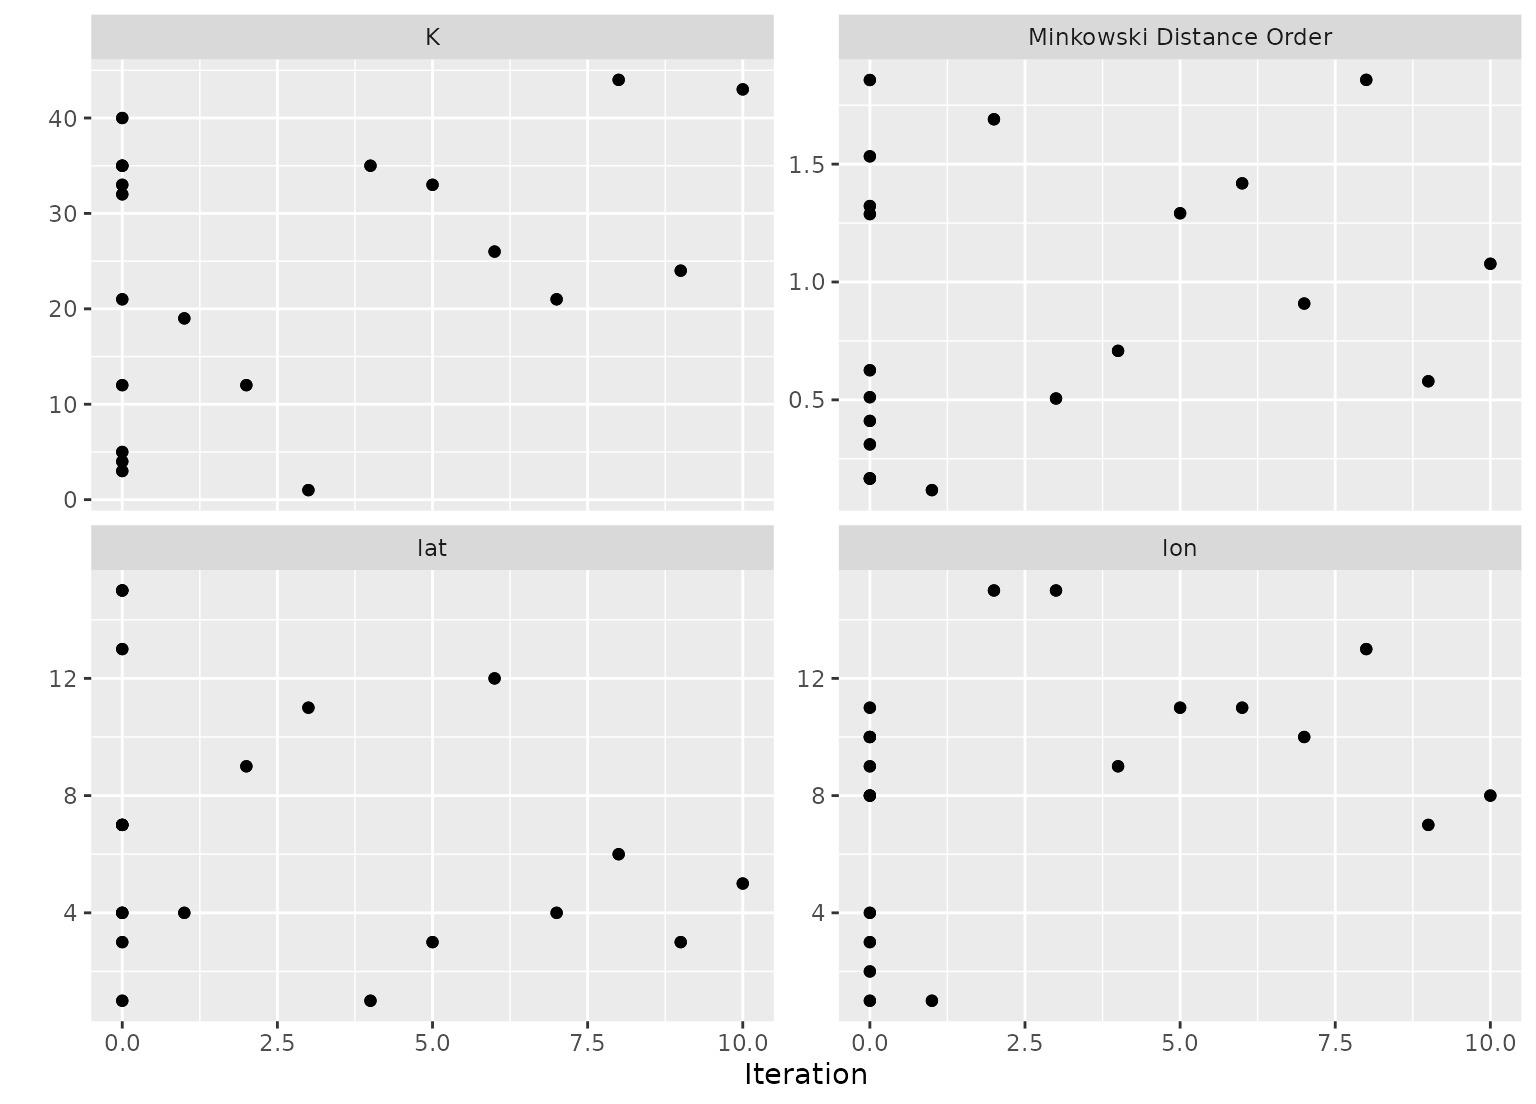
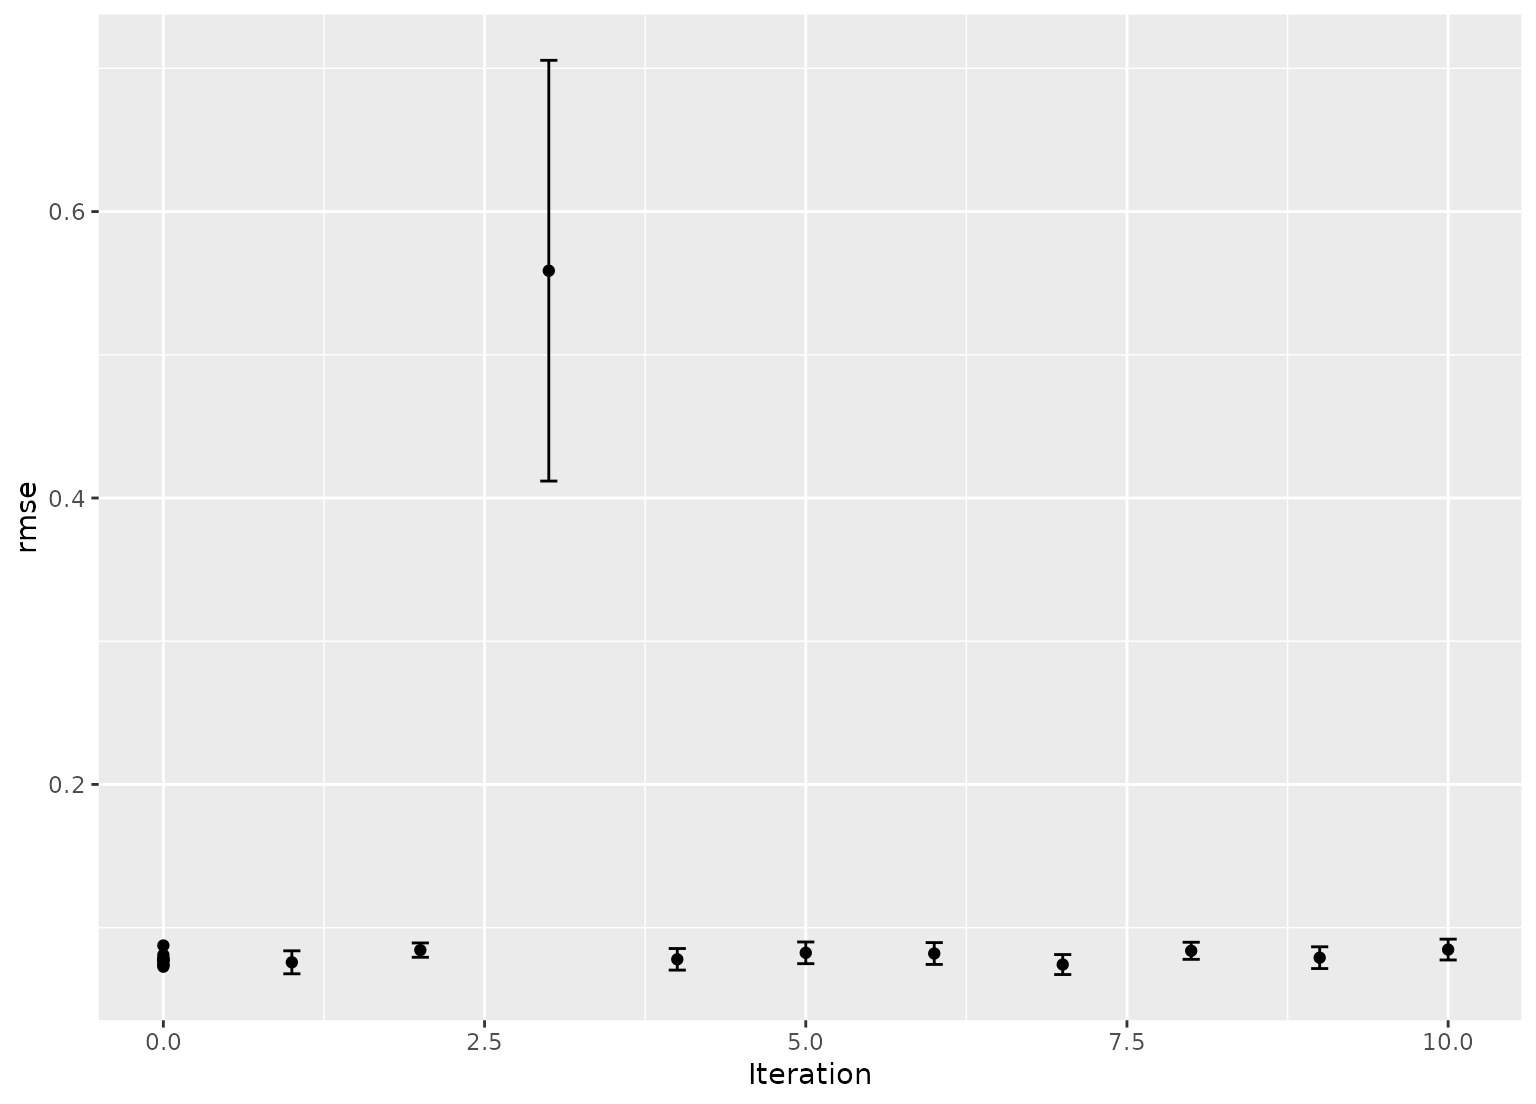
"marginals"(每個預測變量與性能的關係圖;請參閱下麵的詳細信息)、"parameters"(每個參數與搜索迭代)或"performance"(性能與迭代)。後兩個選擇僅用於tune_bayes()。 - metric
-
要繪製其指標的字符向量或
NULL。默認情況下,所有指標都將通過構麵顯示。 - width
-
type = "performance"時置信區間條形寬度的數字。零值會阻止顯示它們。 - ...
-
對於具有規則網格的繪圖,它被傳遞到
format()並應用於用於著色點的參數。否則不使用。
細節
當 tune_grid() 的結果與 autoplot() 一起使用時,它會嘗試確定是否使用了常規網格。
規則網格
對於具有一個或多個數字調整參數的常規網格,在 x 軸上使用具有最唯一值的參數。如果有分類參數,則第一個參數用於為幾何圖形著色。所有其他參數都用於列分麵。
該圖的 y 軸上有性能指標。如果有多個指標,則為row-faceted。
如果調整參數超過五個,則使用 "marginal effects" 圖。
不規則網格
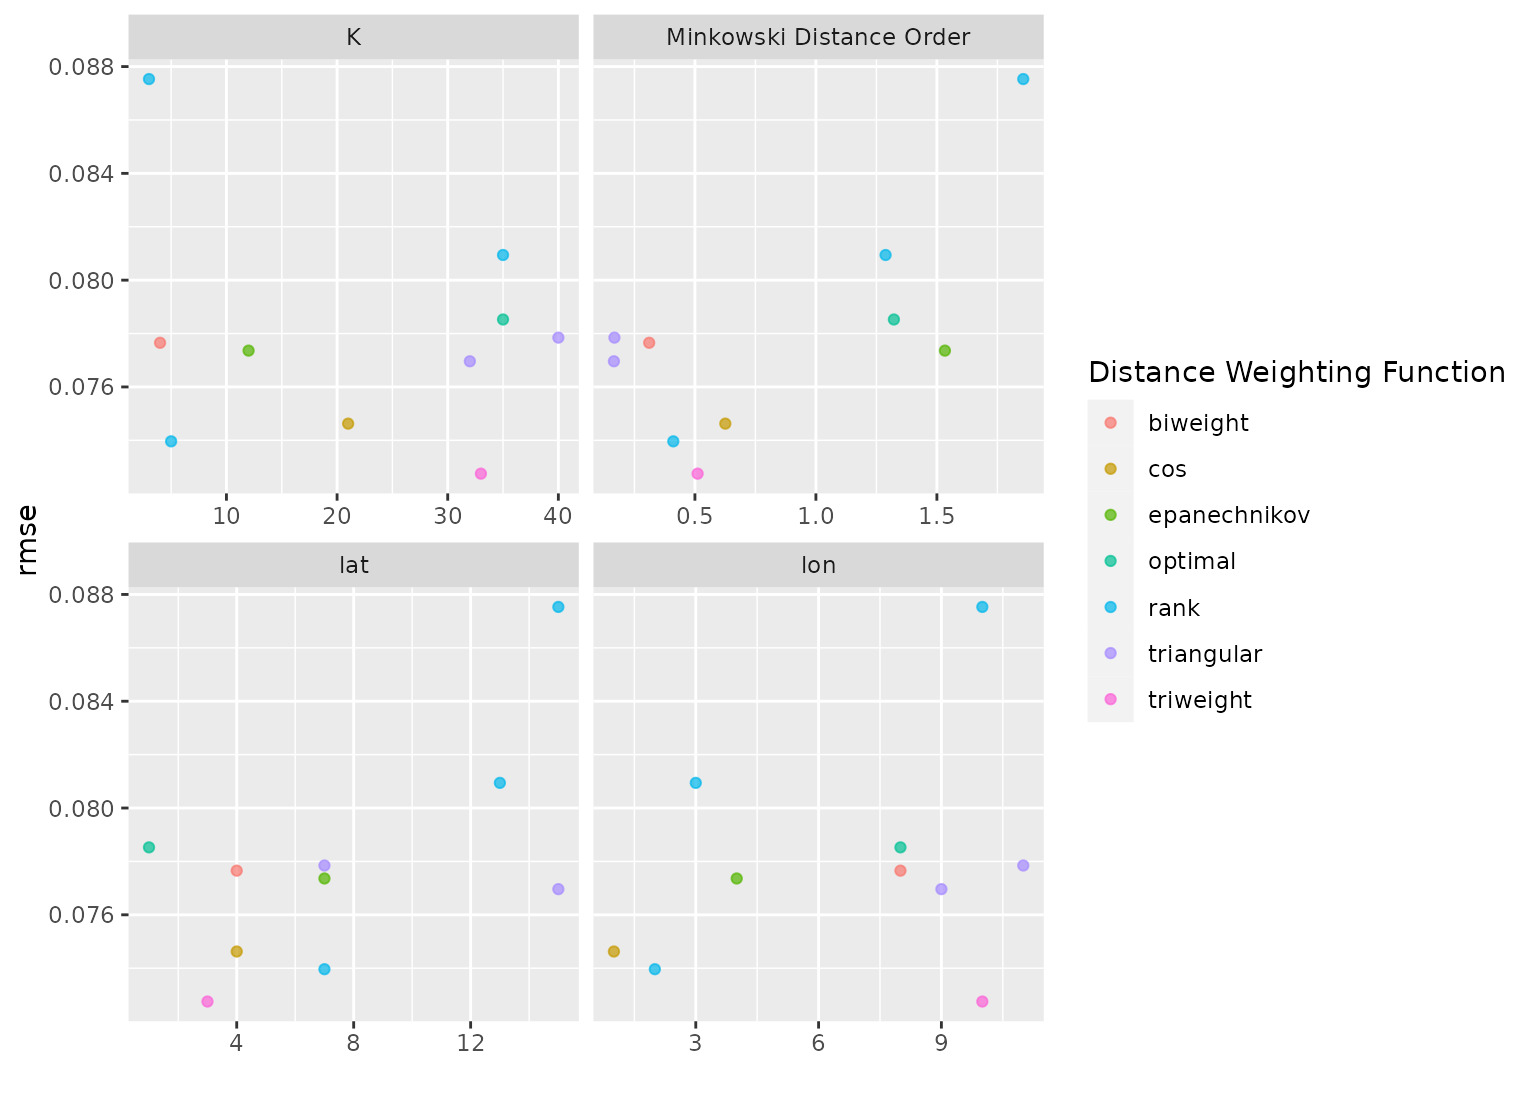
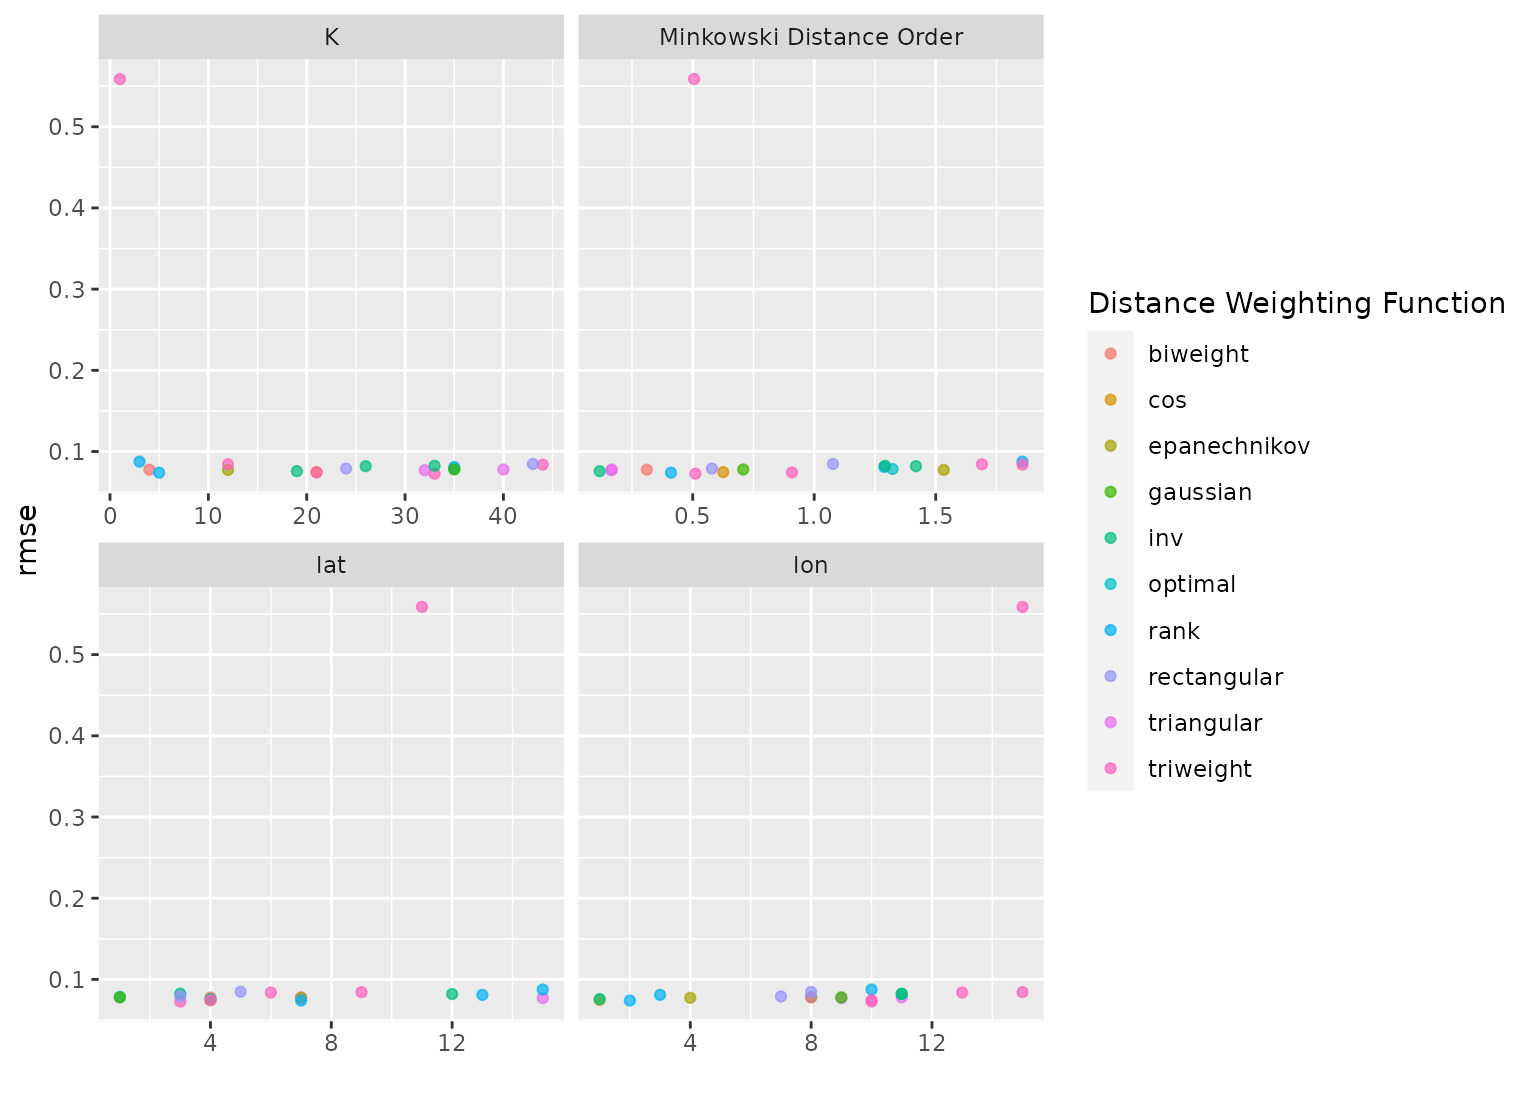
對於space-filling 或隨機網格,將創建邊際效應圖。為每個數字參數製作一個麵板,以便每個參數位於 x 軸上,性能位於 y-xis 上。如果有多個指標,則為row-faceted。
單個分類參數顯示為顏色。如果有兩個或多個非數字參數,則會給出錯誤。當網格中隻有非數字參數時,會出現類似的結果。在這些情況下,我們建議使用 collect_metrics() 和 ggplot() 創建適合數據的繪圖。
如果參數具有與其關聯的關聯變換(由用於創建它的參數對象確定),則繪圖將顯示變換單位中的值(並標有變換類型)。
參數使用參數對象中找到的標簽進行標記,除非使用標識符(例如 neighbors = tune("K") )。
例子
# For grid search:
data("example_ames_knn")

# Plot the tuning parameter values versus performance
autoplot(ames_grid_search, metric = "rmse")


# For iterative search:
# Plot the tuning parameter values versus performance
autoplot(ames_iter_search, metric = "rmse", type = "marginals")


# Plot tuning parameters versus iterations
autoplot(ames_iter_search, metric = "rmse", type = "parameters")


# Plot performance over iterations
autoplot(ames_iter_search, metric = "rmse", type = "performance")

相關用法
- R tune coord_obs_pred 對觀察值與預測值的繪圖使用相同的比例
- R tune extract-tune 提取調整對象的元素
- R tune filter_parameters 刪除一些調整參數結果
- R tune fit_best 將模型擬合到數值最優配置
- R tune conf_mat_resampled 計算重采樣的平均混淆矩陣
- R tune finalize_model 將最終參數拚接到對象中
- R tune tune_bayes 模型參數的貝葉斯優化。
- R tune collect_predictions 獲取並格式化由調整函數產生的結果
- R tune show_best 研究最佳調整參數
- R tune expo_decay 指數衰減函數
- R tune fit_resamples 通過重采樣擬合多個模型
- R tune merge.recipe 將參數網格值合並到對象中
- R tune tune_grid 通過網格搜索進行模型調整
- R tune dot-use_case_weights_with_yardstick 確定案例權重是否應傳遞至標準
- R tune message_wrap 寫一條尊重線寬的消息
- R tune prob_improve 用於對參數組合進行評分的獲取函數
- R tune last_fit 將最終的最佳模型擬合到訓練集並評估測試集
- R update_PACKAGES 更新現有的 PACKAGES 文件
- R textrecipes tokenlist 創建令牌對象
- R themis smotenc SMOTENC算法
- R print.via.format 打印實用程序
- R tibble tibble 構建 DataFrame 架
- R tidyr separate_rows 將折疊的列分成多行
- R textrecipes step_lemma 標記變量的詞形還原
- R textrecipes show_tokens 顯示配方的令牌輸出
注:本文由純淨天空篩選整理自Max Kuhn等大神的英文原創作品 Plot tuning search results。非經特殊聲明,原始代碼版權歸原作者所有,本譯文未經允許或授權,請勿轉載或複製。
