Matplotlib是Python中的一個庫,它是數字的-NumPy庫的數學擴展。 Pyplot是Matplotlib模塊的基於狀態的接口,該模塊提供了MATLAB-like接口。可在Pyplot中使用的各種圖線圖,輪廓圖,直方圖,散點圖,3D圖等。
Matplotlib.pyplot.setp()函數
matplotlib庫的pyplot模塊中的setp()函數用於在藝術家對象上設置屬性。
用法: matplotlib.pyplot.setp(obj, \*args, \*\*kwargs)
參數:此方法接受下麵描述的以下參數:
- obj:此參數是藝術家對象。
- **kwargs:有不同的關鍵字參數可以接受。
返回值:此方法不返回任何值。
以下示例說明了matplotlib.pyplot中的matplotlib.pyplot.setp()函數:
範例1:
Python3
#Implementation of matplotlib function
import numpy as np
import matplotlib.pyplot as plt


def tellme(s):
    plt.title(s, fontsize=16)
    plt.draw()
plt.clf()
plt.setp(plt.gca(), autoscale_on=False)

tellme('matplotlib.pyplot.setp() function Example')
plt.show()
輸出:

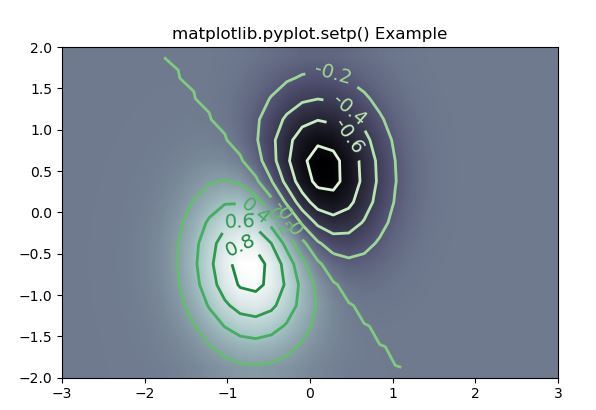
範例2:
Python3
# Implementation of matplotlib function
import matplotlib
import numpy as np
import matplotlib.cm as cm
import matplotlib.pyplot as plt

delta = 0.25
x = np.arange(-3.0, 5.0, delta)
y = np.arange(-1.3, 2.5, delta)
X, Y = np.meshgrid(x, y)
Z = (np.exp(-X**2 - Y**2) - np.exp(-(X - 1)**2 - (Y - 1)**2))

im = plt.imshow(Z, interpolation='bilinear',
                origin='lower',
                cmap="bone",
                extent=(-3, 3, -2, 2))

levels = np.arange(-1.2, 1.6, 0.2)
CS = plt.contour(Z, levels,
                 origin='lower',
                 cmap='Greens',
                 linewidths=2,
                 extent=(-3, 3, -2, 2))

zc = CS.collections[6]
plt.setp(zc, linewidth=2)
plt.clabel(CS, levels,
           inline=1,
           fmt='%1.1f',
           fontsize=14)

plt.title('matplotlib.pyplot.setp() Example')

plt.show()
輸出:
相關用法
- Python Wand function()用法及代碼示例
- Python tell()用法及代碼示例
- Python sum()用法及代碼示例
- Python oct()用法及代碼示例
- Python dir()用法及代碼示例
- Python int()用法及代碼示例
- Python id()用法及代碼示例
- Python now()用法及代碼示例
- Python cmp()用法及代碼示例
- Python ord()用法及代碼示例
- Python str()用法及代碼示例
- Python map()用法及代碼示例
- Python hex()用法及代碼示例
- Python seek()用法及代碼示例
- Python slice()用法及代碼示例
- Python format()用法及代碼示例
- Python join()用法及代碼示例
注:本文由純淨天空篩選整理自SHUBHAMSINGH10大神的英文原創作品 Matplotlib.pyplot.setp() function in Python。非經特殊聲明,原始代碼版權歸原作者所有,本譯文未經允許或授權,請勿轉載或複製。