Matplotlib是Python中的一個庫,它是數字的-NumPy庫的數學擴展。 Pyplot是Matplotlib模塊的基於狀態的接口,該模塊提供了MATLAB-like接口。可在Pyplot中使用的各種圖線圖,輪廓圖,直方圖,散點圖,3D圖等。
matplotlib.pyplot.plot()函數
matplotlib庫的pyplot模塊中的plot()函數用於製作點x,y的2D六角形裝箱圖。
用法: matplotlib.pyplot.plot(\*args, scalex=True, scaley=True, data=None, \*\*kwargs)
參數:此方法接受下麵描述的以下參數:
- x, y:這些參數是數據點的水平和垂直坐標。 x值是可選的。
- fmt:此參數是可選參數,它包含字符串值。
- data:此參數是可選參數,它是帶有標簽數據的對象。
返回值:這將返回以下內容:
- 行:這將返回代表繪製數據的Line2D對象的列表。
以下示例說明了matplotlib.pyplot中的matplotlib.pyplot.plot()函數:
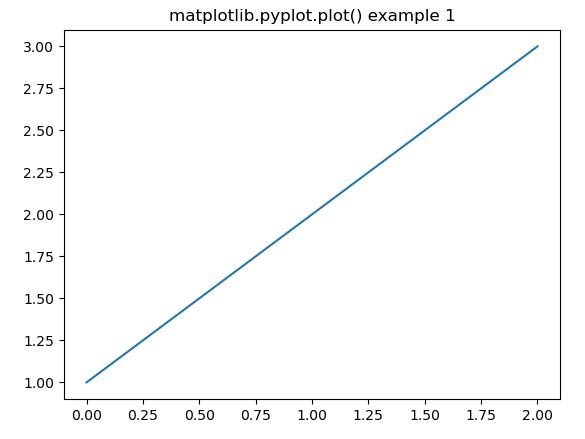
範例1:
# Implementation of matplotlib function

import matplotlib.pyplot as plt
import numpy as np

plt.plot([1, 2, 3])
plt.title('matplotlib.pyplot.plot() example 1')
plt.draw()
plt.show()
輸出:
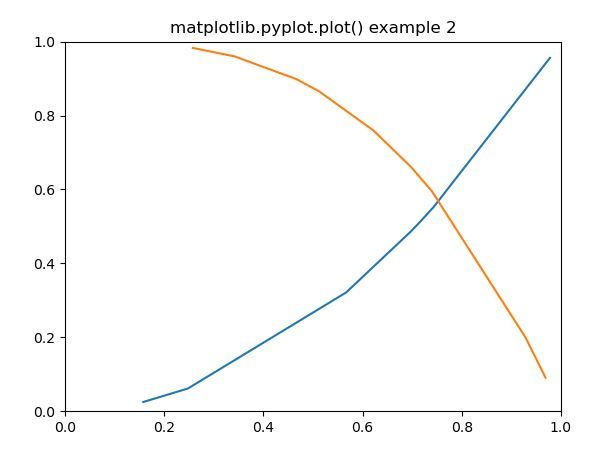
範例2:
# Implementation of matplotlib function

import matplotlib.pyplot as plt
import numpy as np

# Fixing random state for reproducibility
np.random.seed(19680801)

# create random data
xdata = np.random.random([2, 10])

# split the data into two parts
xdata1 = xdata[0,:]
xdata2 = xdata[1,:]

# sort the data so it makes clean curves
xdata1.sort()
xdata2.sort()

# create some y data points
ydata1 = xdata1 ** 2
ydata2 = 1 - xdata2 ** 3

# plot the data
plt.plot(xdata1, ydata1, color ='tab:blue')
plt.plot(xdata2, ydata2, color ='tab:orange')


# set the limits
plt.xlim([0, 1])
plt.ylim([0, 1])

plt.title('matplotlib.pyplot.plot() example 2')

# display the plot
plt.show()
輸出:
相關用法
- Python Wand function()用法及代碼示例
- Python hex()用法及代碼示例
- Python now()用法及代碼示例
- Python oct()用法及代碼示例
- Python int()用法及代碼示例
- Python id()用法及代碼示例
- Python tell()用法及代碼示例
- Python sum()用法及代碼示例
- Python ord()用法及代碼示例
- Python str()用法及代碼示例
- Python cmp()用法及代碼示例
- Python dir()用法及代碼示例
- Python map()用法及代碼示例
- Python fmod()用法及代碼示例
- Python globals()用法及代碼示例
- Python ldexp()用法及代碼示例
注:本文由純淨天空篩選整理自SHUBHAMSINGH10大神的英文原創作品 Matplotlib.pyplot.plot() function in Python。非經特殊聲明,原始代碼版權歸原作者所有,本譯文未經允許或授權,請勿轉載或複製。