Matplotlib是Python中的一個庫,它是數字的-NumPy庫的數學擴展。 Pyplot是Matplotlib模塊的基於狀態的接口,該模塊提供了MATLAB-like接口。可在Pyplot中使用的各種圖線圖,輪廓圖,直方圖,散點圖,3D圖等。
Matplotlib.pyplot.hexbin()函數
matplotlib庫的pyplot模塊中的hexbin()函數用於製作點x,y的2D六角形裝箱圖。
用法: matplotlib.pyplot.hexbin(x, y, C=None, gridsize=100, bins=None, xscale=’linear’, yscale=’linear’, extent=None, cmap=None, norm=None, vmin=None, vmax=None, alpha=None, linewidths=None, edgecolors=’face’, reduce_C_function=, mincnt=None, marginals=False, *, data=None, **kwargs)
參數:此方法接受下麵描述的以下參數:
- x, y:這些參數是數據序列。 x和y的長度必須相同。
- C:此參數是存儲在箱中的值。
- gridsize:此參數表示x方向或兩個方向上的六邊形數量。
- xscale:此參數在水平軸上使用線性或對數刻度。
- xycale:此參數在垂直軸上使用線性或log10標度。
- mincnt:此參數用於顯示單元格中具有最少點數的單元格。
- marginals:此參數用於沿x軸底部和y軸左側繪製顏色映射為矩形的邊際密度。
- extent:此參數是箱子的極限。
返回值:這將返回以下內容:
- 多重集合:這將返回定義六角形框的PolyCollection。
以下示例說明了matplotlib.pyplot中的matplotlib.pyplot.hexbin()函數:
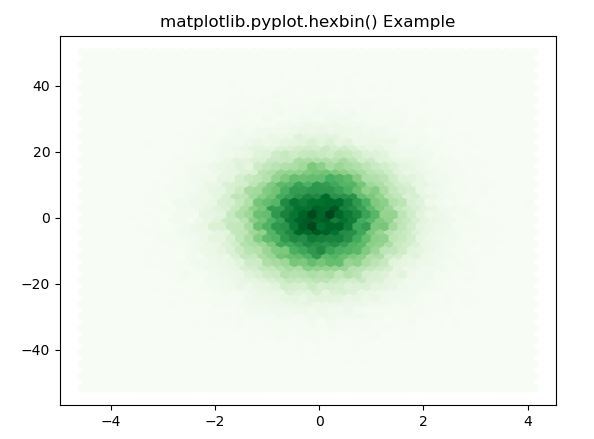
範例1:
Python3
# Implementation of matplotlib function
import matplotlib.pyplot as plt
import numpy as np

np.random.seed(19680801)

n = 100000
x = np.random.standard_normal(n)
y = 12 * np.random.standard_normal(n)

plt.hexbin(x, y, gridsize = 50, cmap ='Greens')
plt.title('matplotlib.pyplot.hexbin() Example')
plt.show()
輸出:
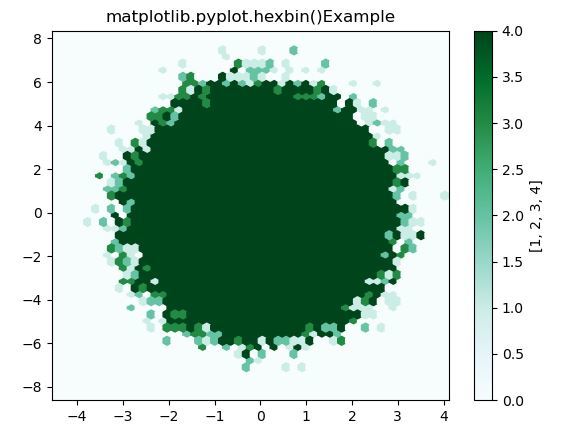
範例2:
Python3
# Implementation of matplotlib function
import matplotlib.pyplot as plt
import numpy as np

np.random.seed(19680801)

n = 100000
x = np.random.standard_normal(n)
y = 2 * np.random.standard_normal(n)
z =[1, 2, 3, 4]
xmin = x.min()
xmax = x.max()
ymin = y.min()
ymax = y.max()

hb = plt.hexbin(x, y, gridsize = 50,
               bins = z, cmap ='BuGn')

plt.xlim(xmin, xmax)
plt.ylim(ymin, ymax)

cb = plt.colorbar(hb)
cb.set_label(z)
plt.title('matplotlib.pyplot.hexbin()\
Example')

plt.show()
輸出:
相關用法
- Python Wand function()用法及代碼示例
- Python hex()用法及代碼示例
- Python tell()用法及代碼示例
- Python sum()用法及代碼示例
- Python oct()用法及代碼示例
- Python id()用法及代碼示例
- Python now()用法及代碼示例
- Python str()用法及代碼示例
- Python map()用法及代碼示例
- Python cmp()用法及代碼示例
- Python ord()用法及代碼示例
- Python dir()用法及代碼示例
- Python int()用法及代碼示例
- Python Wand fx()用法及代碼示例
- Python property()用法及代碼示例
- Python ldexp()用法及代碼示例
- Python fmod()用法及代碼示例
注:本文由純淨天空篩選整理自SHUBHAMSINGH10大神的英文原創作品 Matplotlib.pyplot.hexbin() function in Python。非經特殊聲明,原始代碼版權歸原作者所有,本譯文未經允許或授權,請勿轉載或複製。