Matplotlib是Python中的一個庫,它是數字的-NumPy庫的數學擴展。它是Python中令人驚歎的可視化庫,用於數組的2D圖,並用於與更廣泛的SciPy堆棧配合使用。
Matplotlib.axis.Tick.set_transform()函數
matplotlib庫的軸模塊中的Tick.set_transform()函數用於設置藝術家變換。
用法: Tick.set_transform(self, t)
參數:此方法接受以下參數。
- t:此參數是“變換”。
返回值:此方法不返回任何值。
以下示例說明了matplotlib.axis中的matplotlib.axis.Tick.set_transform()函數:
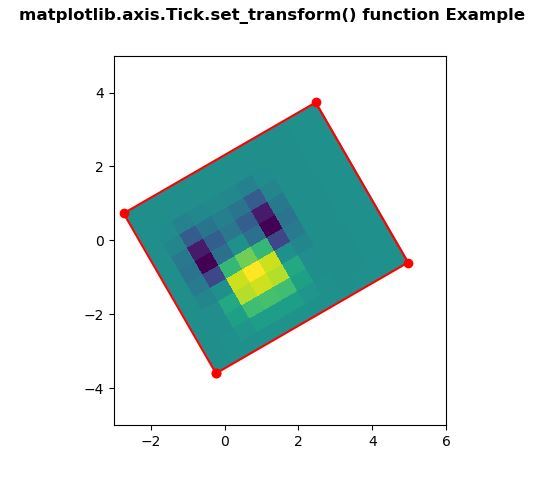
範例1:
Python3
# Implementation of matplotlib function
from matplotlib.axis import Tick
import numpy as np
import matplotlib.pyplot as plt
import matplotlib.transforms as mtransforms

delta = 0.5

x = y = np.arange(-2.0, 4.0, delta)
X, Y = np.meshgrid(x**2, y)

Z1 = np.exp(-X**2 - Y**2)
Z2 = np.exp(-(X - 1)**2 - (Y - 1)**2)
Z = (Z1 - Z2)

transform = mtransforms.Affine2D().rotate_deg(30)
fig, ax = plt.subplots()

im = ax.imshow(Z, interpolation ='none',
               origin ='lower',
               extent =[-2, 4, -3, 2],
               clip_on = True)

trans_data = transform + ax.transData
Tick.set_transform(im, trans_data)

x1, x2, y1, y2 = im.get_extent()
ax.plot([x1, x2, x2, x1, x1],
        [y1, y1, y2, y2, y1],
        "ro-",
        transform = trans_data)

ax.set_xlim(-3, 6)
ax.set_ylim(-5, 5)

fig.suptitle('matplotlib.axis.Tick.set_transform() \
function Example', fontweight ="bold")

plt.show()
輸出:
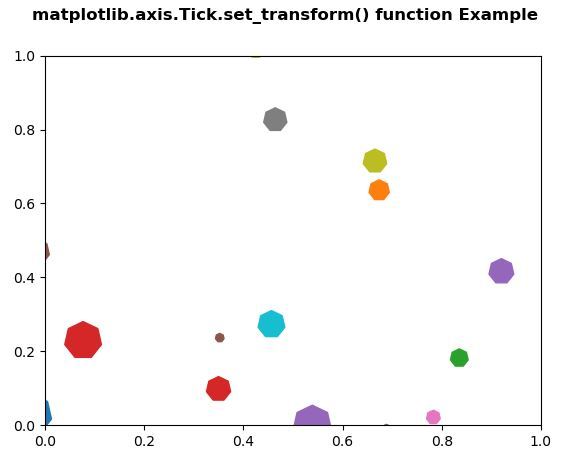
範例2:
Python3
# Implementation of matplotlib function
from matplotlib.axis import Tick
import matplotlib.pyplot as plt
from matplotlib import collections, colors, transforms
import numpy as np

nverts = 50
npts = 100

r = np.arange(nverts)
theta = np.linspace(0, 2 * np.pi, nverts)

xx = r * np.sin(theta)
yy = r * np.cos(theta)

spiral = np.column_stack([xx, yy])

rs = np.random.RandomState(19680801)

xyo = rs.randn(npts, 2)

colors = [colors.to_rgba(c)
          for c in plt.rcParams['axes.prop_cycle'].by_key()['color']]

fig, ax1 = plt.subplots()

col = collections.RegularPolyCollection(
    7, sizes = np.abs(xx) * 10.0,
    offsets = xyo,
    transOffset = ax1.transData)

trans = transforms.Affine2D().scale(fig.dpi / 72.0)
Tick.set_transform(col, trans)

ax1.add_collection(col, autolim = True)
col.set_color(colors)

fig.suptitle('matplotlib.axis.Tick.set_transform() \
function Example', fontweight ="bold")

plt.show()
輸出:
相關用法
- Python Wand function()用法及代碼示例
- Python int()用法及代碼示例
- Python tell()用法及代碼示例
- Python map()用法及代碼示例
- Python str()用法及代碼示例
- Python dir()用法及代碼示例
- Python id()用法及代碼示例
- Python hex()用法及代碼示例
- Python now()用法及代碼示例
- Python sum()用法及代碼示例
- Python oct()用法及代碼示例
- Python ord()用法及代碼示例
- Python cmp()用法及代碼示例
- Python join()用法及代碼示例
- Python fsum()用法及代碼示例
- Python strftime()用法及代碼示例
- Python isdisjoint()用法及代碼示例
注:本文由純淨天空篩選整理自SHUBHAMSINGH10大神的英文原創作品 Matplotlib.axis.Tick.set_transform() function in Python。非經特殊聲明,原始代碼版權歸原作者所有,本譯文未經允許或授權,請勿轉載或複製。