Matplotlib是Python中的一個庫,它是數字的-NumPy庫的數學擴展。它是Python中令人驚歎的可視化庫,用於數組的2D圖,並用於與更廣泛的SciPy堆棧配合使用。
Matplotlib.axis.Tick.properties()函數
matplotlib庫的axis模塊中的Tick.properties()函數用於獲取包含藝術家所有屬性的字典。
用法: Tick.properties(self)
參數:此方法不接受任何參數。
返回值:此方法返回藝術家所有屬性的字典。
以下示例說明了matplotlib.axis中的matplotlib.axis.Tick.properties()函數:
範例1:
Python3
# Implementation of matplotlib function
from matplotlib.axis import Tick
import numpy as np
import matplotlib.pyplot as plt


xx = np.random.rand(3, 4)

fig, ax = plt.subplots()

m = ax.pcolor(xx)
m.set_zorder(2)

w = Tick.properties(ax)
print("Display first 10 Properties\n")
for i in list(w)[:10]:
    print(i, ":", w[i])

fig.suptitle('matplotlib.axis.Tick.properties() \
function Example', fontweight ="bold")

plt.show()
輸出:
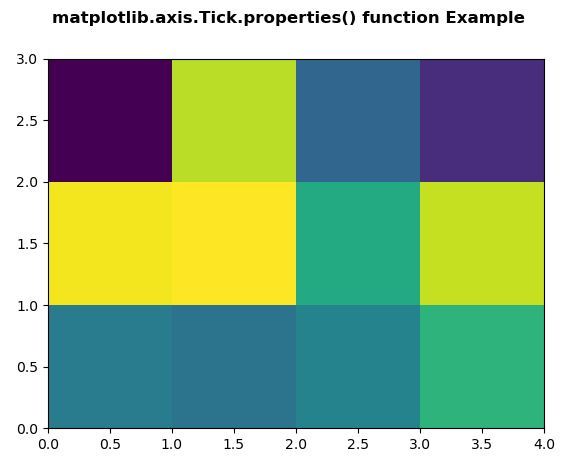
Display first 10 Properties

adjustable:box
agg_filter:None
alpha:None
anchor:C
animated:False
aspect:auto
autoscale_on:True
autoscalex_on:True
autoscaley_on:True
axes_locator:None
範例2:
Python3
# Implementation of matplotlib function
from matplotlib.axis import Tick
import matplotlib.pyplot as plt
import numpy as np


np.random.seed(10**7)
geeks = np.random.randn(100)

fig, ax = plt.subplots()
ax.acorr(geeks, usevlines = True,
         normed = True,
         maxlags = 25, lw = 3)

ax.grid(True)

w = Tick.properties(ax)
print("Display last 10 Properties\n")
for i in list(w)[-10:]:
    print(i, ":", w[i])

fig.suptitle('matplotlib.axis.Tick.properties() \
function Example', fontweight ="bold")

plt.show()
輸出:
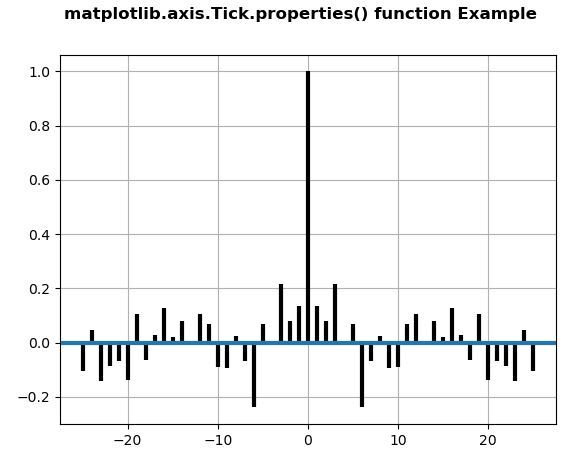
Display last 10 Properties

ygridlines:
ylabel:
ylim:(-0.300605326634452, 1.061933586982593)
ymajorticklabels:
yminorticklabels:
yscale:linear
yticklabels:
yticklines:
yticks:[-0.4 -0.2  0.   0.2  0.4  0.6  0.8  1.   1.2]
zorder:0
相關用法
- Python Wand function()用法及代碼示例
- Python now()用法及代碼示例
- Python map()用法及代碼示例
- Python ord()用法及代碼示例
- Python hex()用法及代碼示例
- Python tell()用法及代碼示例
- Python int()用法及代碼示例
- Python oct()用法及代碼示例
- Python id()用法及代碼示例
- Python cmp()用法及代碼示例
- Python str()用法及代碼示例
- Python dir()用法及代碼示例
- Python sum()用法及代碼示例
- Python property()用法及代碼示例
- Python format()用法及代碼示例
- Python range()用法及代碼示例
注:本文由純淨天空篩選整理自SHUBHAMSINGH10大神的英文原創作品 Matplotlib.axis.Tick.properties() function in Python。非經特殊聲明,原始代碼版權歸原作者所有,本譯文未經允許或授權,請勿轉載或複製。