Matplotlib是Python中的一個庫,它是數字的-NumPy庫的數學擴展。它是Python中令人驚歎的可視化庫,用於數組的2D圖,並用於與更廣泛的SciPy堆棧配合使用。
matplotlib.axis.Axis.set_minor_formatter()函數
matplotlib庫的軸模塊中的Axis.set_minor_formatter()函數用於設置次要股票代碼的格式化程序。
用法: Axis.set_minor_formatter(self, formatter)
參數:此方法接受以下參數。
- formatter:此參數是格式化程序。
返回值:此方法不返回任何值。
以下示例說明了matplotlib.axis中的matplotlib.axis.Axis.set_minor_formatter()函數:
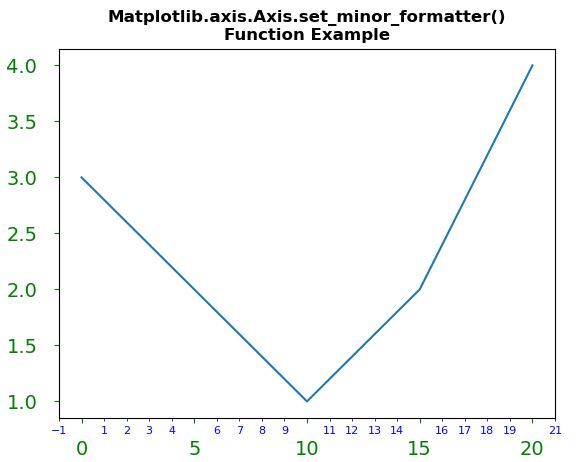
範例1:
Python3
# Implementation of matplotlib function
from matplotlib.axis import Axis
import matplotlib.pyplot as plt
from matplotlib.ticker import MultipleLocator, ScalarFormatter

fig, ax = plt.subplots()
ax.plot([0, 5, 10, 15, 20], [3, 2, 1, 2, 4])

Axis.set_minor_locator(ax.xaxis, MultipleLocator(1))
Axis.set_minor_formatter(ax.xaxis, ScalarFormatter())

ax.tick_params(axis ='both', which ='major',
               labelsize = 14, pad = 12,
               colors ='g')

ax.tick_params(axis ='both', which ='minor',
               labelsize = 8, colors ='b')

plt.title("Matplotlib.axis.Axis.set_minor_formatter()\n\
Function Example", fontsize = 12, fontweight ='bold')

plt.show()
輸出:
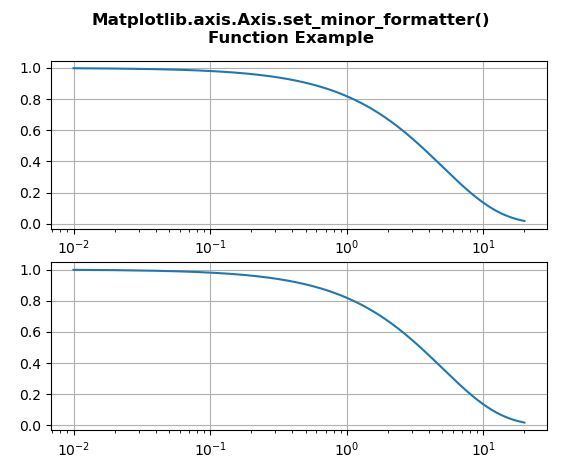
範例2:
Python3
# Implementation of matplotlib function
from matplotlib.axis import Axis
import matplotlib.pyplot as plt
from matplotlib.ticker import LogFormatter
import numpy as np

fig, axes = plt.subplots(2)

dt = 0.01
t = np.arange(dt, 20.0, dt)

# first plot doesn't use a formatter
axes[0].semilogx(t, np.exp(-t / 5.0))
axes[0].grid()

xlims = [[0, 25], [0.2, 8], [0.6, 0.9]]

for ax, xlim in zip(axes[1:], xlims):

    ax.semilogx(t, np.exp(-t / 5.0))
    formatter = LogFormatter(labelOnlyBase = False,
                             minor_thresholds = (2, 0.4))

    Axis.set_minor_formatter(ax.xaxis, formatter)
    ax.grid()

fig.suptitle("Matplotlib.axis.Axis.set_minor_formatter()\n\
Function Example", fontsize = 12, fontweight ='bold')

plt.show()
輸出:
相關用法
- Python Wand function()用法及代碼示例
- Python map()用法及代碼示例
- Python cmp()用法及代碼示例
- Python oct()用法及代碼示例
- Python ord()用法及代碼示例
- Python str()用法及代碼示例
- Python dir()用法及代碼示例
- Python sum()用法及代碼示例
- Python hex()用法及代碼示例
- Python now()用法及代碼示例
- Python tell()用法及代碼示例
- Python int()用法及代碼示例
- Python id()用法及代碼示例
- Python cmath.sin()用法及代碼示例
注:本文由純淨天空篩選整理自SHUBHAMSINGH10大神的英文原創作品 Matplotlib.axis.Axis.set_minor_formatter() function in Python。非經特殊聲明,原始代碼版權歸原作者所有,本譯文未經允許或授權,請勿轉載或複製。